Case studyMedbridgeHealthcare
Turning NPS into clinic insight, from one tap to the regional view
In 2016, physical therapy was consolidating, and regional managers were accountable for clinic profits just as reimbursement began to hinge on patient outcomes. They had little insight into how patients actually experienced their clinics. As Medbridge’s product design manager, I led design of a way to capture that experience inside the GO patient app, and a platform that turned it into daily insight for every level of clinic management. Sales closed all four enterprise commitments made before development began. I also tried to build a design practice inside a sales-driven, top-down company, with mixed results.
- Company
- Medbridge, continuing education and exercise programs for physical therapy; privately owned
- My role
- Product Design Manager
- When
- 2016 to 2017
- Team
- Four product designers
- Reported to
- Chief Operating Officer
Results
The products we designed
- 4 of 4enterprise commitments for the NPS platform, made before development, closed
- 4.6★rating for the GO patient app, which I inherited and iterated, from more than 9,000 iOS and Android reviews
I left Medbridge as the NPS platform launched, before there was post-launch data to report.
The service
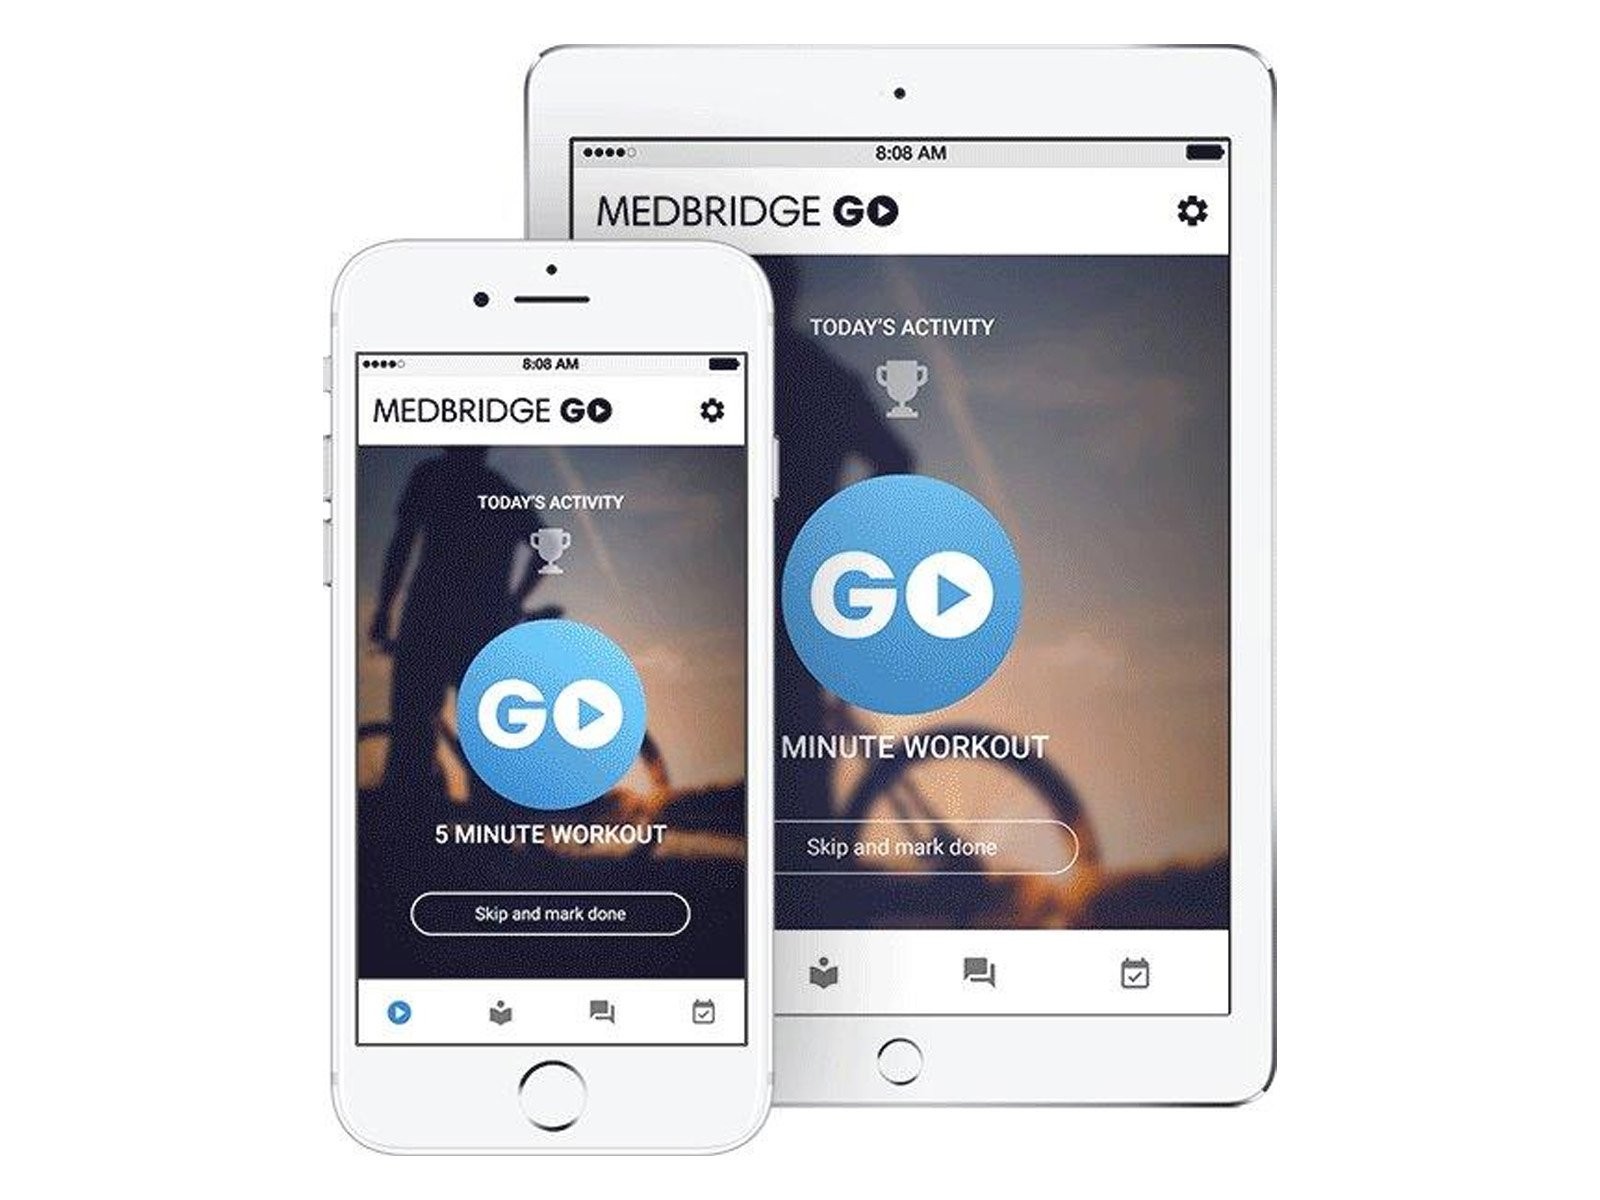
Medbridge led the market in continuing education for physical therapists and in the home exercise programs therapists assign to patients during recovery. A therapist builds a program, and the patient follows it in the Medbridge GO app, which became an industry standard.
The problem
The physical therapy industry was in the middle of consolidation, and the regional manager had quickly become an archetypal role. These managers carried profit and loss for groups of clinics, in a world where patient outcomes were on the verge of driving insurance reimbursement. Yet they had little insight into the actual experience of patients at their clinics.
The opportunity was to capture patient feedback, and to design a platform that presented it, quantitative and qualitative, to every level of clinic management.
The system
Feedback had to travel from a patient in the middle of rehab to the people running the clinic:
- PatientFollows an exercise program in the GO app between visits
- GO appAsks how likely they are to recommend the clinic, and what stood out
- Clinic managerSees scores and feedback for their own clinic
- Regional managerCompares clinics, providers, and trends across the region
Each part of the system carried its own constraint:
- Recovery came firstThe ask couldn’t interrupt a patient’s rehab program
- NPS measures the brandA recommendation score says little about a provider, or why a patient felt the way they did
- Every organization differedCustomers had different management hierarchies and cared about different parts of the experience
- Scores could hurt peopleProviders feared being blamed for clinic problems outside their control
- Outcomes were becoming moneySome ways of slicing satisfaction were risky in an outcome-based reimbursement world
- Research was a hard sellIn a sales-driven B2B company, we couldn’t arrange proper interviews with therapists or managers
What I did
A Net Promoter Score tells a manager whether patients would recommend the clinic, not why. My strategy was to make the why as measurable as the score, and to put it in front of each manager with enough context that a low number led to a fix, not to blame.
In practice, that meant:
- Ask without interrupting recovery. Time the question to the patient’s progress, not the clinic’s calendar.
- Make the why measurable. Turn what stood out about a visit into one-click data.
- Start each manager’s day with context. Show trends and drivers first, scoped to what they own.
- Compare without blame. Give managers comparisons and patients’ own words, without turning a clinic score into a verdict on a provider.
- Build the practice around the work. Give the company a shared way to build, find research where we could, put design upstream of the sprint, and grow the team.
I worked as a player-coach. On this platform, I was the interaction designer, working with one of my product designers on the interface, while coaching a team of four and consulting across the Patient Engagement, Patient Retention and Marketing, Practice Management, and Education and Training verticals.
Track one
Building the NPS platform
From a question in the patient’s app to a daily view for every level of clinic management.
Ask without interrupting recovery
We framed the patient side with two questions: how might we make an unobtrusive NPS ask of patients, and how might we augment NPS to capture qualitative feedback as quantitative data?
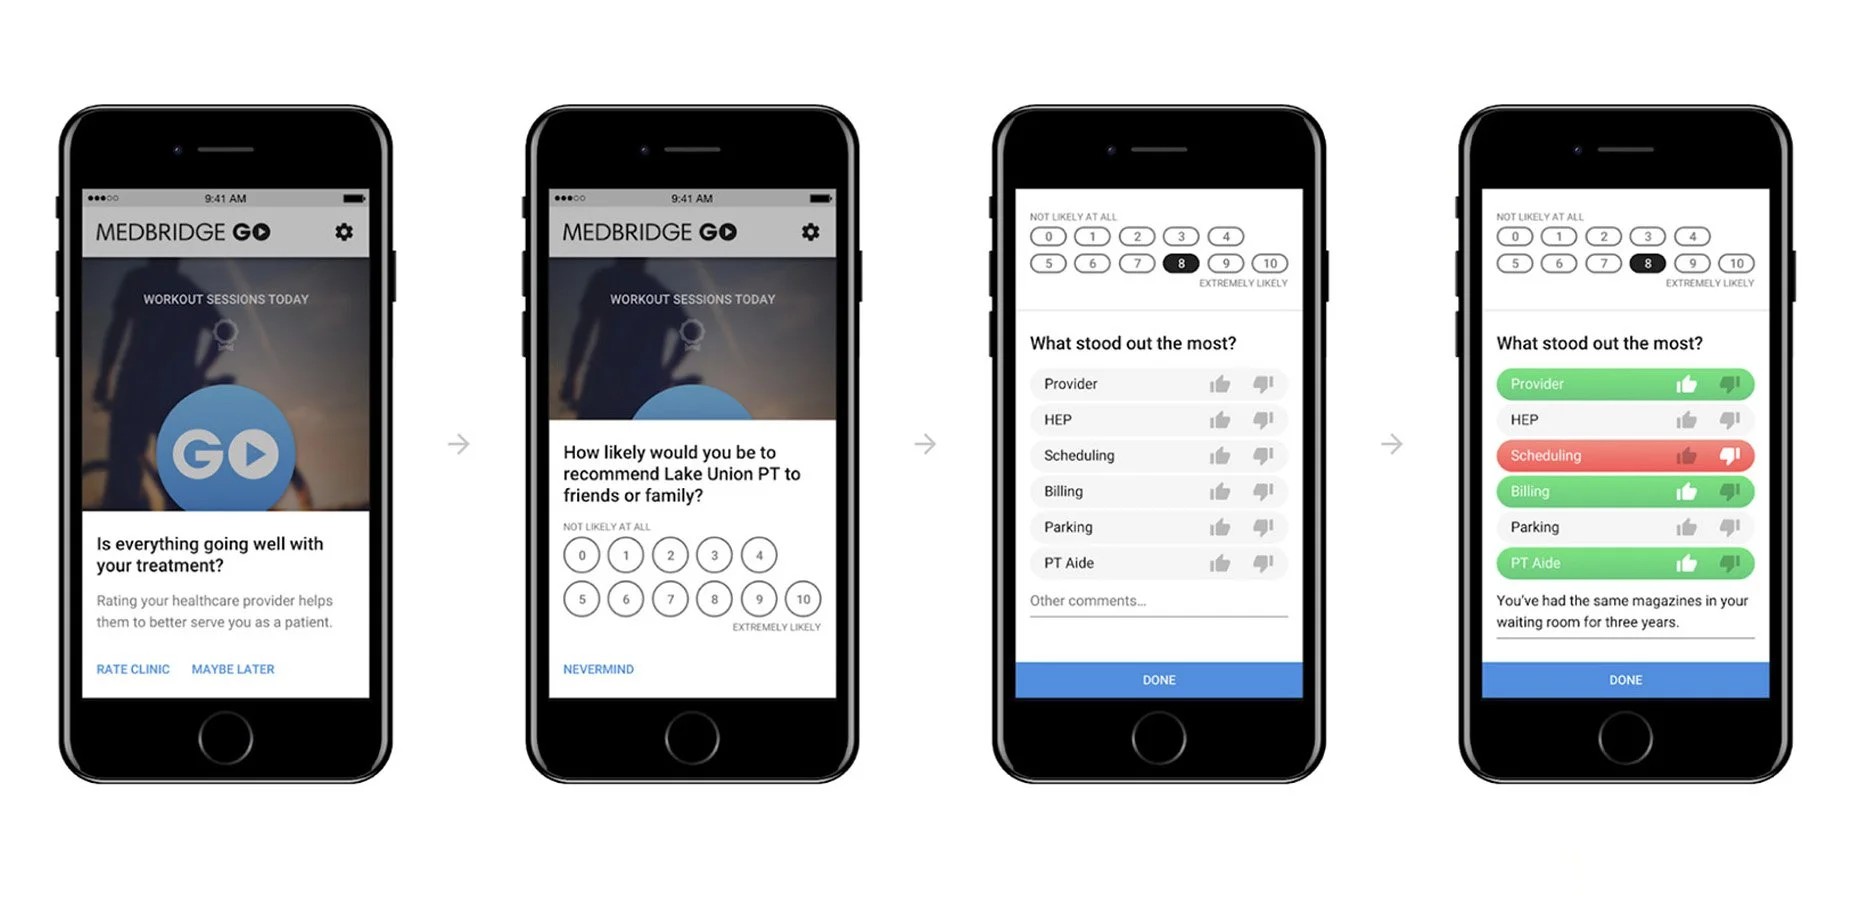
The first came down to timing. Patients opened the GO app to do their exercises, not to rate their clinic. We decided the ask would appear conditionally, only after a patient had gone through at least two progressions of their rehab program, so they had real experience to rate and the question didn’t get in the way of starting their recovery.
Make the why measurable
Our first design was a standard 0 to 10 NPS question. When we showed the prototype to physical therapists in their clinics, and explained that managers would be able to sort scores by clinician, they pushed back. A single number could reflect badly on their care when something else entirely, like parking, was the real problem for a patient.
That reframed the work. We realized the score alone wasn’t enough, and hypothesized that the specific interactions between a patient and the clinic, whether non-existent parking or a consistently amazing physical therapist, were the foundation of the overall score, and might be as valuable to clinic management as the NPS itself.
So after the score, the app asked what stood out, with customizable one-click experience tags: provider, home exercise program, scheduling, billing, parking, front desk, and more. A patient could give a tag a thumbs up or down in a single tap, and add comments if they wanted. That turned the reasons behind a score into quantitative data managers could act on immediately, and each customer could choose which tags were in play.
Start each manager’s day with context
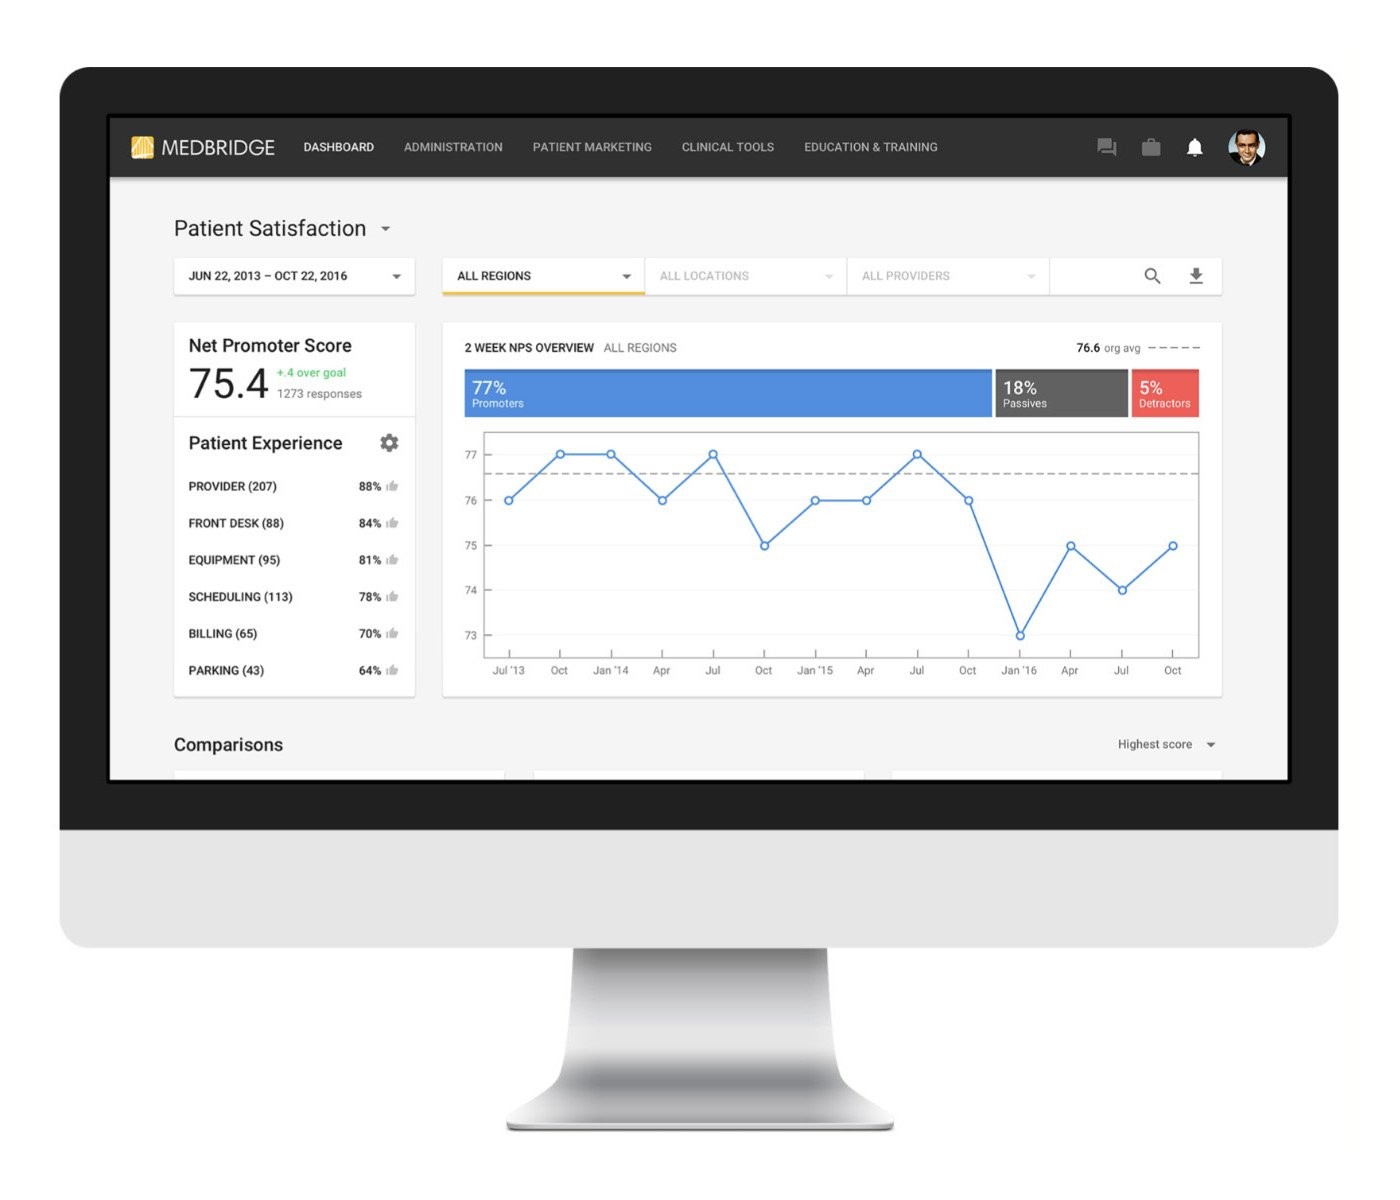
When a manager began their day, the platform led with context: a 90-day trailing view of NPS, and each experience tag with a score representing discrete levels of satisfaction. A manager could see not only where the score was going, but which parts of the experience were moving it.
No two customers were organized the same way. We designed the platform to allow for permutations of organization models, both in the management hierarchy and in which experience tags were in play, so the same views worked for a single clinic or a regional network.
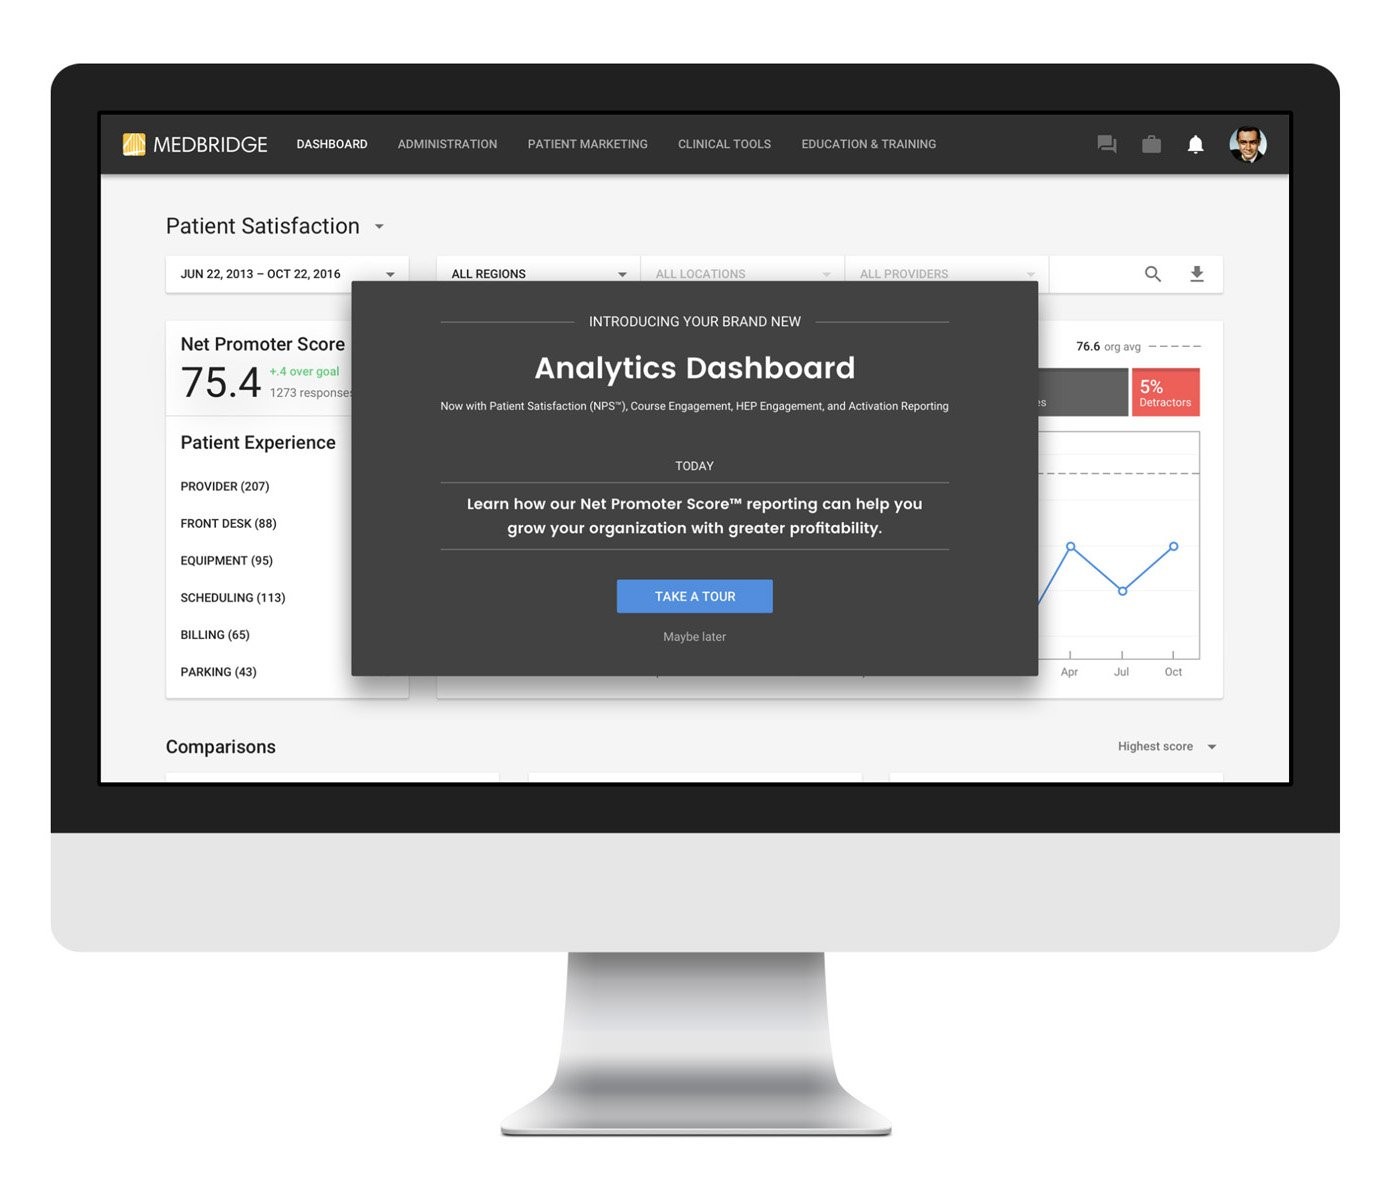
Rounding out the platform were a simple onboarding feature that introduced the dashboard, and a search that returned only the regions, locations, and providers each user was responsible for.
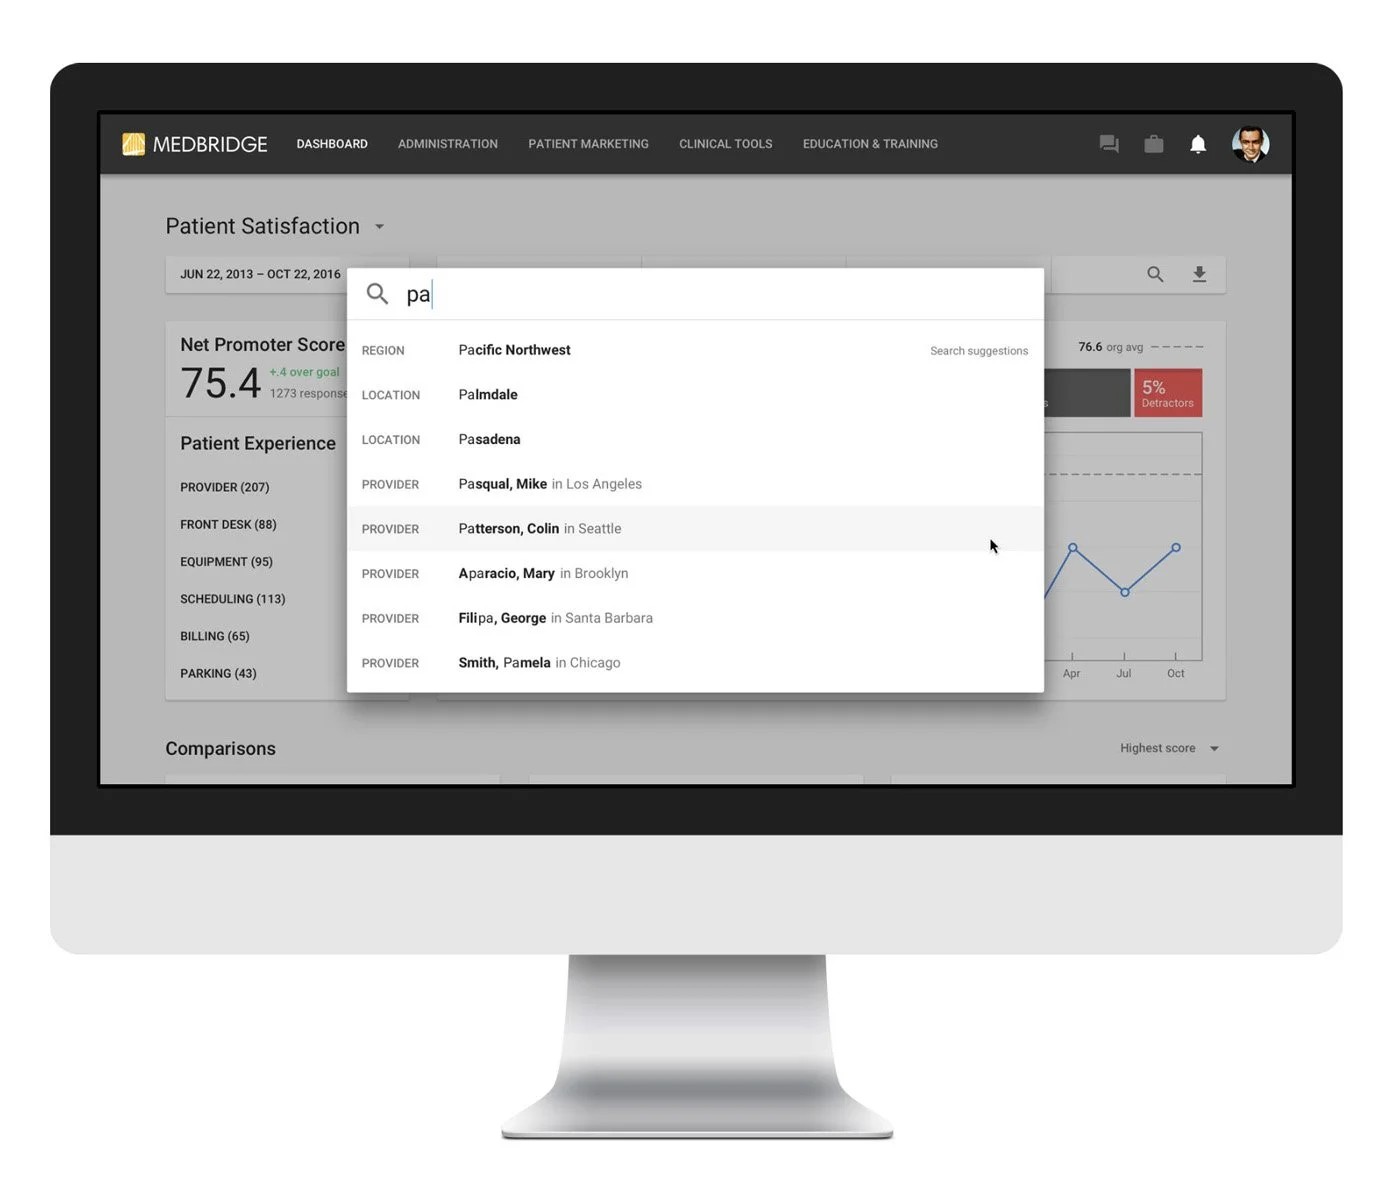
Compare without blame
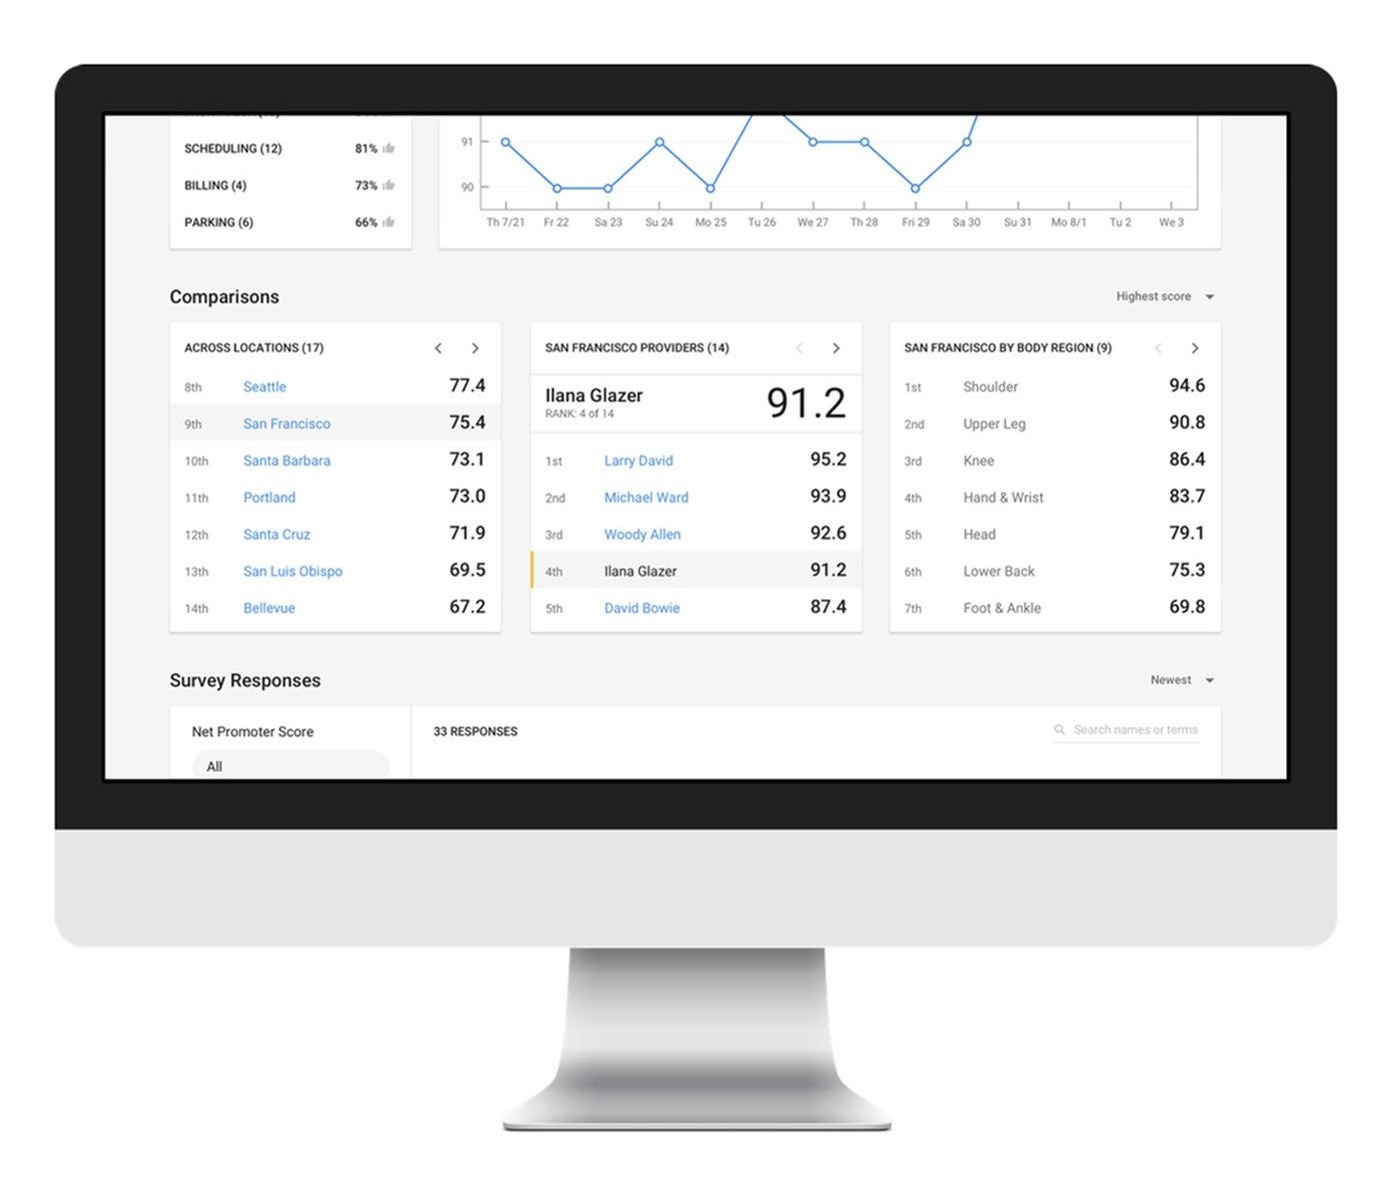
Comparisons helped managers see how their operations performed against other groups, and each one was designed around what it could fairly say:
- Locations. Regional managers saw comparative summaries of their top clinics, with clinic-level detail. Clinic managers saw only top-level scores, enough for friendly competition without exposing other clinics’ details.
- Providers. NPS measured willingness to recommend the brand, so at best it correlated loosely with a provider’s performance. The provider tag captured provider-specific scoring, which addressed managers’ concerns more directly than NPS could.
- Body region. I argued against this one. NPS measures willingness to recommend, not injury outcomes, and ranking satisfaction by body region, which tracked providers’ areas of focus, invited managers to read it as a measure of treatment quality in a world where outcomes drove insurance payments. I lost that call, and body region shipped.
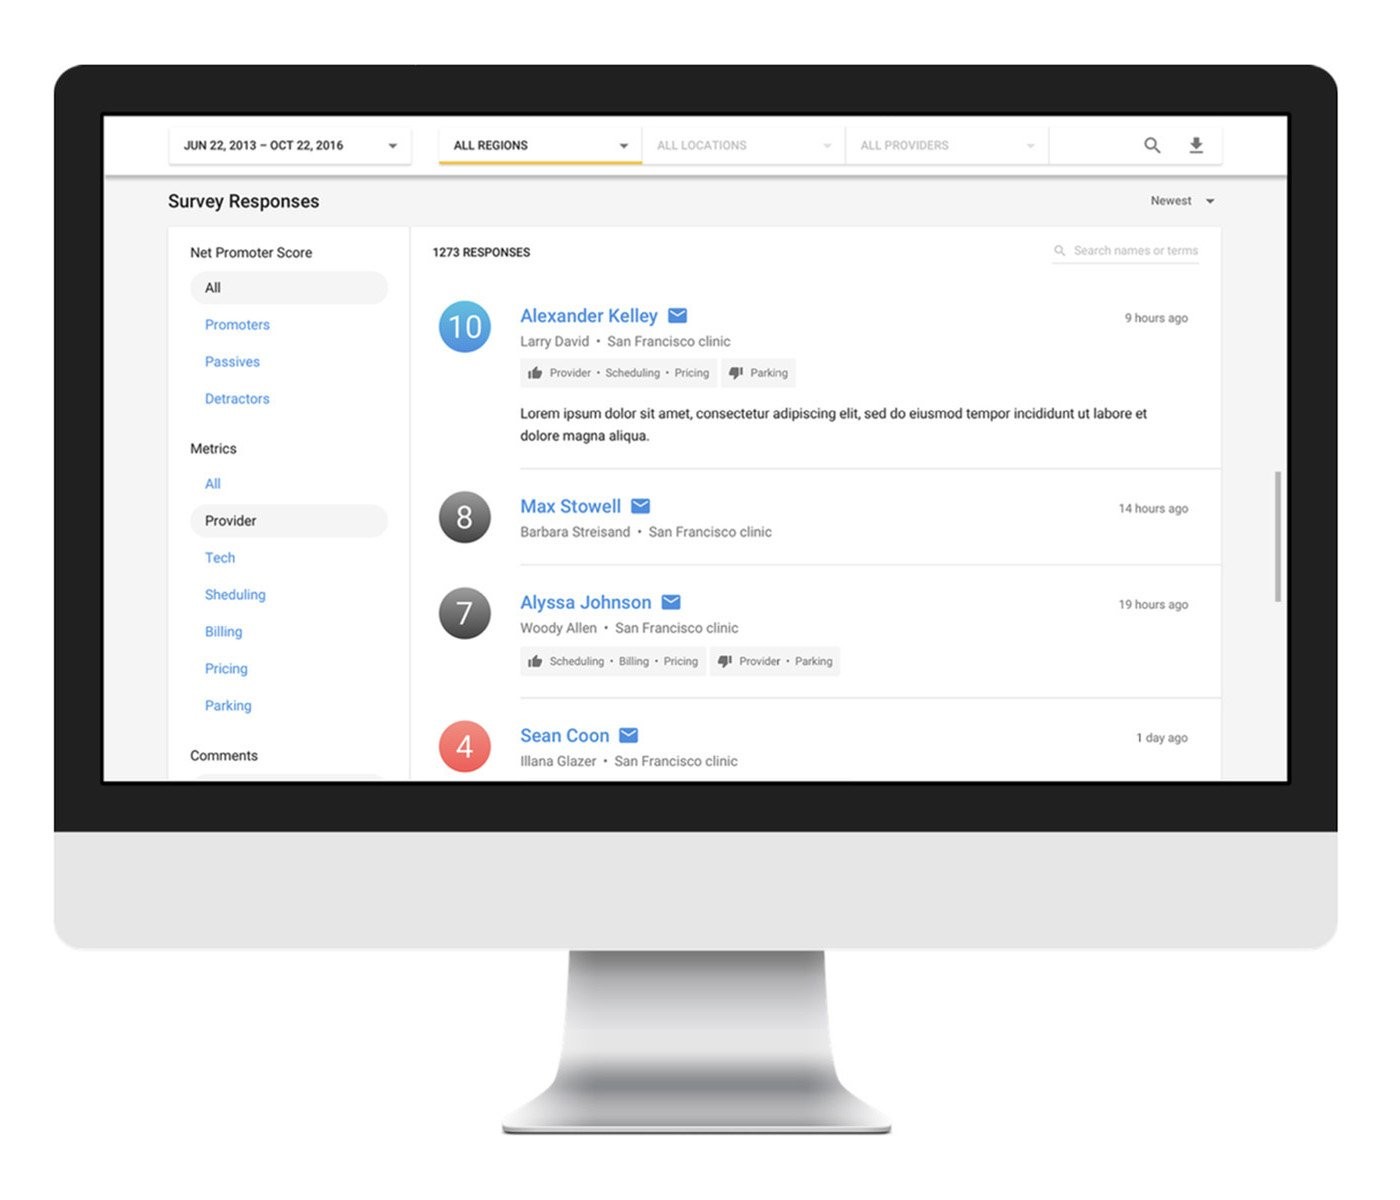
The bottom third of the display presented every comment patients left. Qualitative feedback gave context to the scores, which mattered most when a manager was trying to get to the root of a problem.
We were conscious of not fostering workplaces where providers might be reprimanded for low clinic scores that had nothing to do with the care they gave. The one-click tags helped here too: a bad score tied to parking or billing read differently from one tied to the provider.
Track two
Building the practice
Give the company a shared way to build, find evidence where we could, give design a real place in the engineering process, and grow the team.
Find research where the company would allow it
Investing in user research inside a B2B organization can be a difficult sell, and we couldn’t arrange a proper set of interviews with physical therapists or clinic managers. So we pursued insight as situations arose.
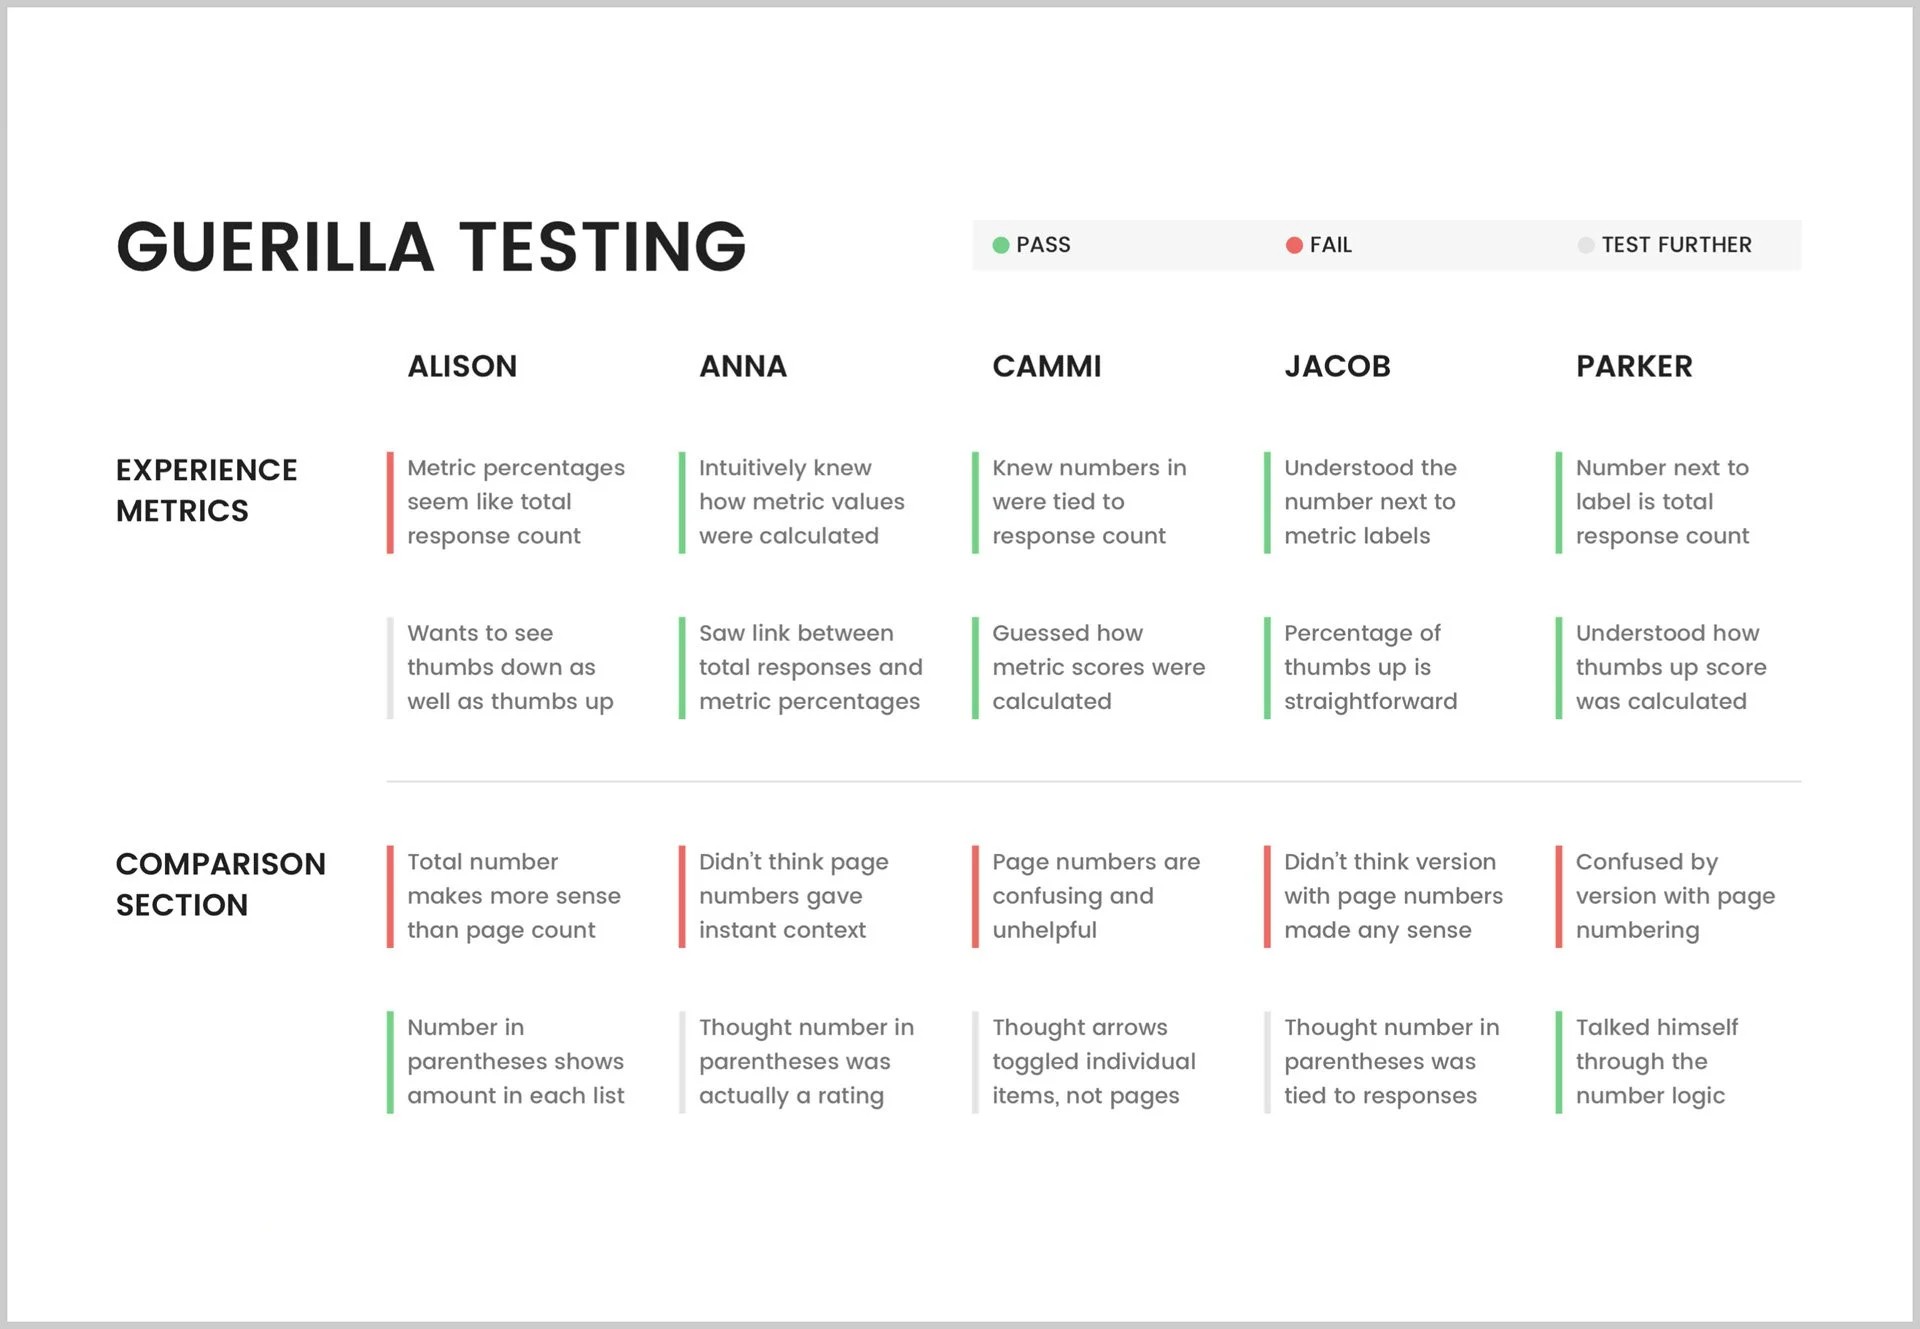
To test usability, we ran guerrilla tests with Medbridge employees who had no exposure to the initiative. They surfaced specific interface issues, like how metric percentages related to total responses, that we were able to fix quickly. When we could get into clinics, we shadowed therapists at work before showing them prototypes. Those visits produced the project’s most important finding: the therapists’ concern about clinic scores, which reshaped both the patient ask and the comparisons.
Put design upstream of the sprint
Medbridge was my first in-house experience with Agile; before, I had integrated my studio team into clients’ cadences as a remote consultant. I landed squarely in the GO and NPS work inside what amounted to a feature factory: product managers wrote requirements, engineers built them in three-week sprints with the first week dedicated to planning, and there was no room for product design. Starting with the NPS platform, since GO was already in market, I negotiated for design prototypes to serve as direct input to user stories, and design worked outside the sprint unless we were consulting on a build. That gave us room to iterate on artifacts and have the conversations the work needed.
I inherited a small team, managed through attrition, and doubled it to four product designers while leveling up their skills. I staffed them to design new products and to cover the existing verticals, and coached them as they did.
Make the case for an informed product culture
The room for design was negotiated, not built in, and I needed buy-in on a documented method so I wouldn’t have to operate with my hair on fire again. Halfway through my time at Medbridge, I wrote one: a shared way to decide how much to invest in a product, how to research and validate it, and how product, design, and development should work together. It rested on four principles:
- Market sensitive. Every product starts as a market decision: build new, reboot, or iterate.
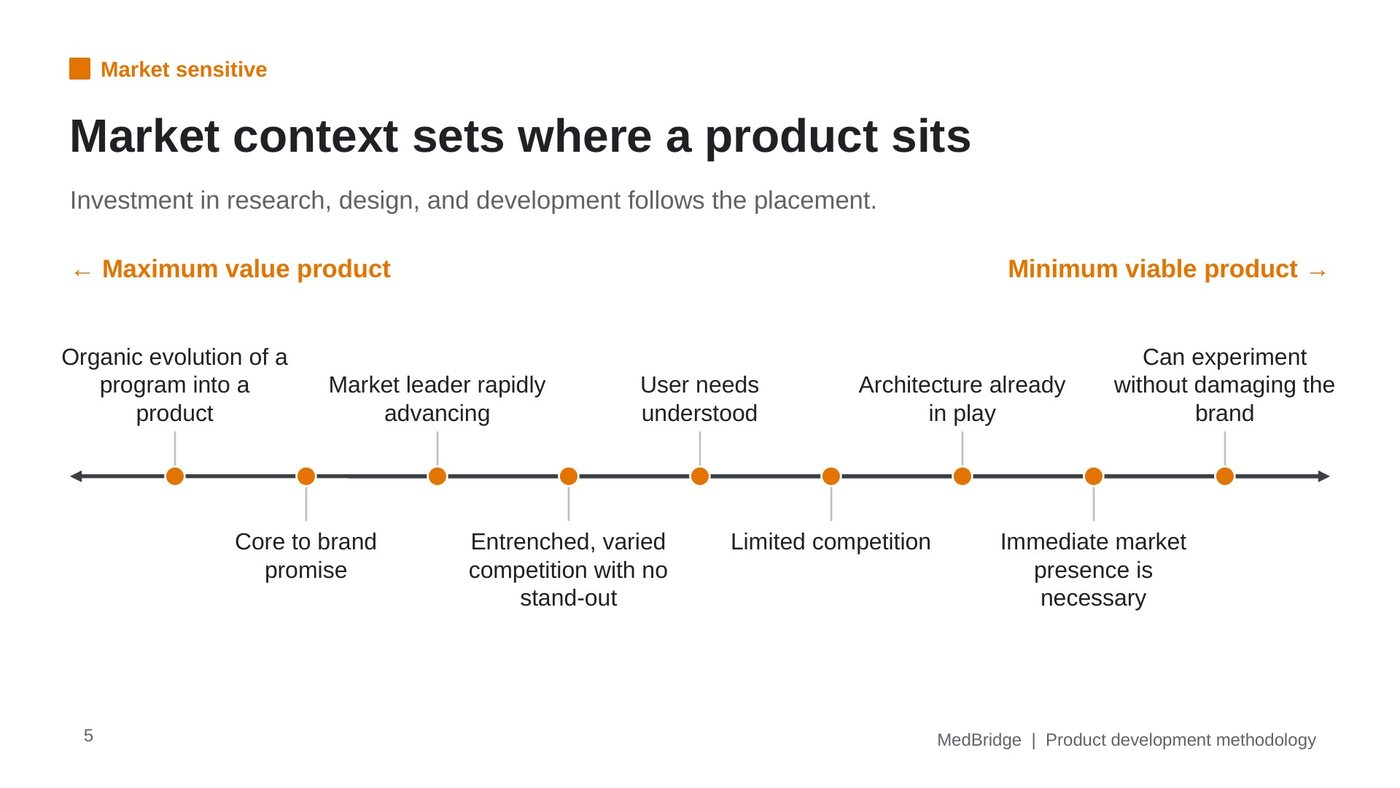
- Situationally flexible. Market context sets where a product sits on a continuum from maximum value to minimum viable, and investment in research, design, and development follows that placement.
- Feedback driven. Buyers and users shape the product at defined touchpoints.
- Highly collaborative. Product, design, development, and subject matter experts work from one shared process.
Two upcoming products showed the range. Outcomes tracking was core to the brand promise, in a market with several players and no clear leader, so it belonged near the maximum value end: research every role in the outcomes ecosystem and invest in the right architecture. Telehealth had no dominant leader eating into market share, so a first release could be an experiment: one scenario, such as a patient scheduling a call with their therapist, built on existing services like Skype rather than custom video.
Beyond sizing, it set out how to do the work. New products moved through research and validation: generative research and journey maps to set strategy, then reviews of low- and high-fidelity prototypes with users and buyers. Existing products moved through assessment against KPIs and usage, then iteration, a reboot, or a freeze. And an eight-step process set who owned what, from the product owner setting the hypothesis, to design mapping the journey while development explored architecture, to design reviews at the end of each sprint and again before shipping.
This was influence work: mentoring a young PM team toward the methodology while making the case to the executive team for a different way of making product decisions. The PMs adopted parts of it. But the company ran on a command-and-control culture, and that kind of change only went as far as the CEO was willing to share the decisions.
In their words
“Sean and I worked our way through many a dry erase marker while at MedBridge. What I appreciate most about Sean is his seemingly endless cognitive capacity: he has the ability to tirelessly zoom in and out on a market, product, or use case until a better experience is shipped. When it came to execution, Sean not only managed the Product Design team, he also rolled up his sleeves and pumped out Sketch files in lockstep with his team members. Sean is a leader equally at home in the details and at 10,000 feet.”
“To work with Sean is to gain access to one of the brightest, passionate, and thoughtful personalities one could hope to collaborate with in the design industry. […] Whether spearheading vision work with an eye towards the future, mapping user flows with all their complexity, or digging into the minutia of a single user interaction, Sean approached it all with supreme focus, care, and always a sense of possibility and ‘what can we do better?’ He’s incredibly fair, encouraging, respectful and authentic. These are traits that make a great leader.”
Key learnings
- In B2B, learn how sales sees the work before arguing for craft.This was my first time leading design in a B2B company, where sales drove everything and every decision was viewed through that lens. I came in expecting a deeper investment in design than the company was used to making, and I underestimated how closely I needed to work with sales and front-line teams to earn room for it. The NPS platform showed what that alignment could do: sales made four enterprise commitments before development began, and all four closed. I’d start there now: understand how the business sells, then make the case for quality in those terms.
- The best insight came from the access we didn’t plan for.We couldn’t get proper interviews, and the finding that reshaped the product came from showing therapists a prototype during clinic visits. In a company where research is a hard sell, I’d make the case for direct access to customers earlier, using what we learned by chance as the argument.
- Where design sits in the process shapes what design can do.Medbridge was my first in-house role in a decade, and my first inside an Agile cadence. Negotiating for prototypes to feed user stories directly, with design working ahead of the sprint, gave us the room to iterate and to have the conversations the work needed. Without that, design would have been squeezed into a three-week cycle built for engineering. Anywhere I lead design now, I settle that placement early.
- Authority comes from relationships, not frameworks.I left the corporate world in 2005 because I couldn’t navigate the politics of leading design from the bottom of an engineering organization. I built strong relationships as a consultant over the next decade, but building them from inside an organization is different. The methodology made that plain. A framework for deciding how much to invest in a product is really a claim on who makes that call, and I wrote mine for a PM team that didn’t report to me, in a company where the CEO made those calls. The PMs used parts of it; the decisions stayed where they were. Today I’d start with the executive who owns investment decisions, and build the framework with them rather than for them.
Questions about this project? Email me.