Case studyInter-American Development BankDevelopment finance
Making the IDB’s work across Latin America easy to find and explore
The Inter-American Development Bank finances projects across Latin America and the Caribbean, and its website held decades of data about them, in progress or finished. The data was there, but it wasn’t an experience. As the only UX designer on Studio Analogous’s team, I worked across two years and three launches: a rebranded iadb.org organized around projects, countries, and sectors; Mapamericas, which put every project in context on a map; and a portal that made the bank’s courses easy to find.
- Client
- Inter-American Development Bank, Washington, D.C.
- Studio
- Studio Analogous, led by Fanny Krivoy and Josh Goldberg
- My role
- Staff UX designer, the only UX designer on the engagement
- When
- 2014 to 2015
- Team
- Visual designers Isabella and Alejandra
Results
After launch
- 300%increase in project traffic
- 200%growth in mobile usage
- 3launches: the redesigned site, Mapamericas, and the courses portal
Traffic and mobile figures as reported by Studio Analogous.
The client
The IDB is the World Bank of Latin America: it finances projects, shapes policy, and produces research across the region. Its website served everyone who touched that work, from ministry staff and executing agencies to contractors bidding on projects, companies seeking financing, investors, journalists, and the bank’s own country representatives.
Each of them came with a different job to do, in a different country, often in a different language.
The problem
The bank’s work was on the site, but hard to see. The issues that mattered most:
- Projects were recordsData on projects in progress or finished, with no way to explore it
- The homepage told the wrong storyIt led with people and country videos, not the projects behind them
- Doing business was buriedProcurement and financing paths were hard to find for the people who needed them most
- Expertise was hiddenResearch and publications didn’t establish the bank as a knowledge leader
- Too many audiences for one personaA ministry staffer, a mining executive, and a reporter all needed different things
- Courses were hard to reachPeople struggled to find courses, to enroll, or even to know they existed
What I did
My strategy was to put the bank’s projects at the center: the proof of the brand, the backbone of navigation, and something anyone could explore in context, wherever they entered the site.
In practice, that meant:
- Model expectations across a region. Fit the research model to an audience too broad for one primary persona.
- Navigate by projects, countries, and sectors. Rebuild the site’s structure around the bank’s work.
- Give every country and sector a front door. Templates that lead with projects, results, and opportunities.
- Put the map inside every page. Start from how the bank used project data, and turn a destination into context.
- Make courses findable. Give the bank’s learning offerings clear paths to discovery and registration.
I was the only UX designer on the engagement, working full time from Greensboro with regular trips to Washington and New York. I did the research synthesis, information architecture, interaction design, and design strategy. Visual designers Isabella and Alejandra brought the wireframes to life, and Fanny Krivoy and Josh Goldberg led the engagement for Studio Analogous.
Track one
Rebuilding iadb.org
From research to a site map and templates, 2014.
Model expectations across a region
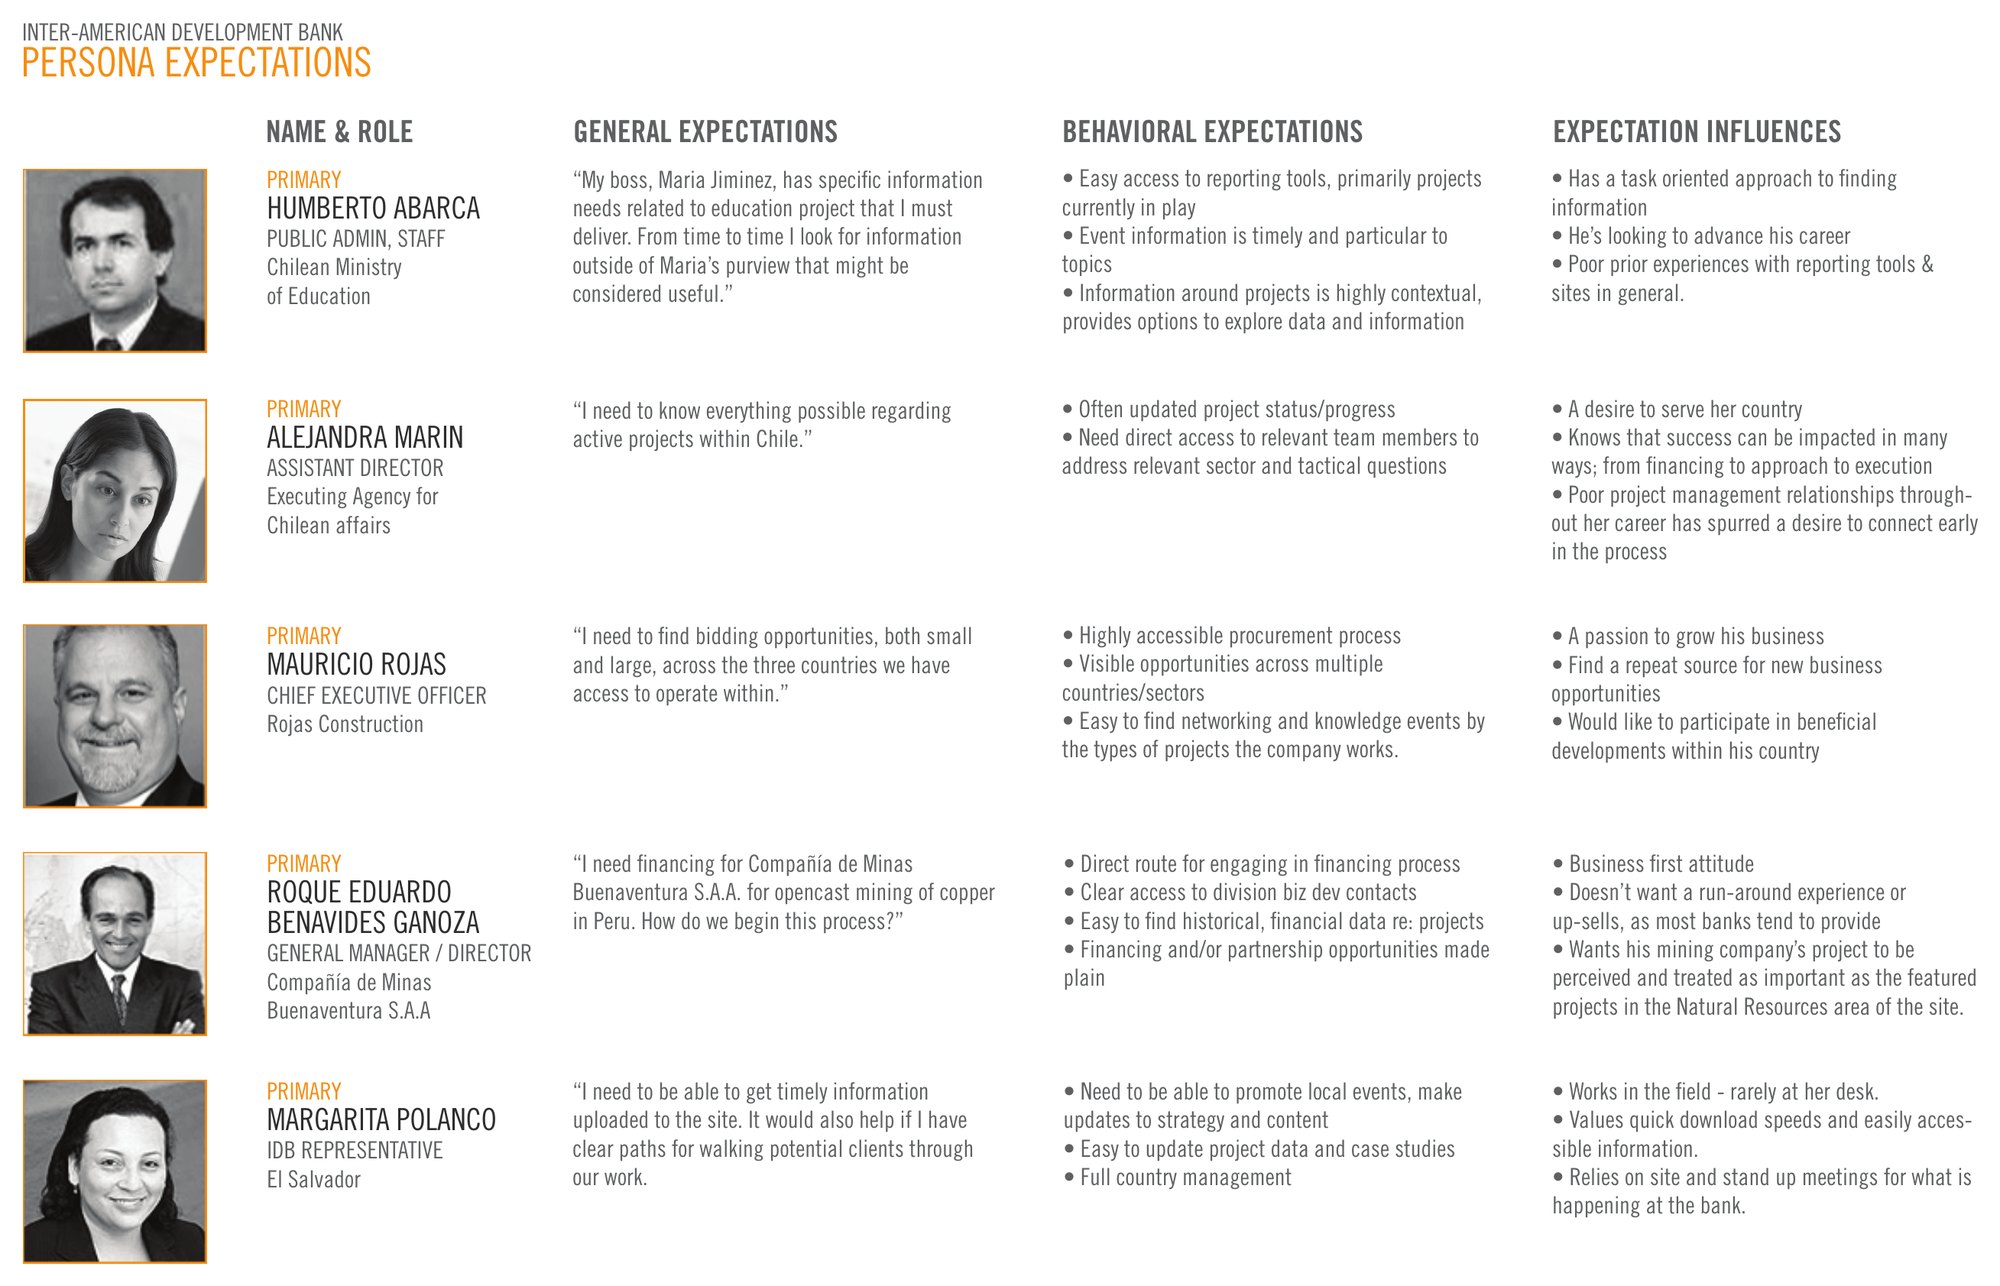
The research came from interview records a previous firm had run, along with information about the roles that engaged with the bank. The question was how to model it. The IDB served people across South and Central America, from government workers to educators to business owners, and their jobs to be done were too diverse to narrow into product-specific primary personas.
So I modeled persona expectations, a format consistent with Alan Cooper’s Goal-Directed Design. For each role, it captured three things: general expectations, in the person’s own words; behavioral expectations of the site; and the influences behind them. Humberto, a staffer at Chile’s Ministry of Education, needed reporting on education projects for his boss. Mauricio, a construction CEO, needed bidding opportunities across the three countries where his company could operate. Margarita, an IDB representative in El Salvador, worked in the field and needed to update her country’s pages quickly. Secondary roles included a fund manager weighing IDB bonds and a reporter on deadline.
Navigate by projects, countries, and sectors
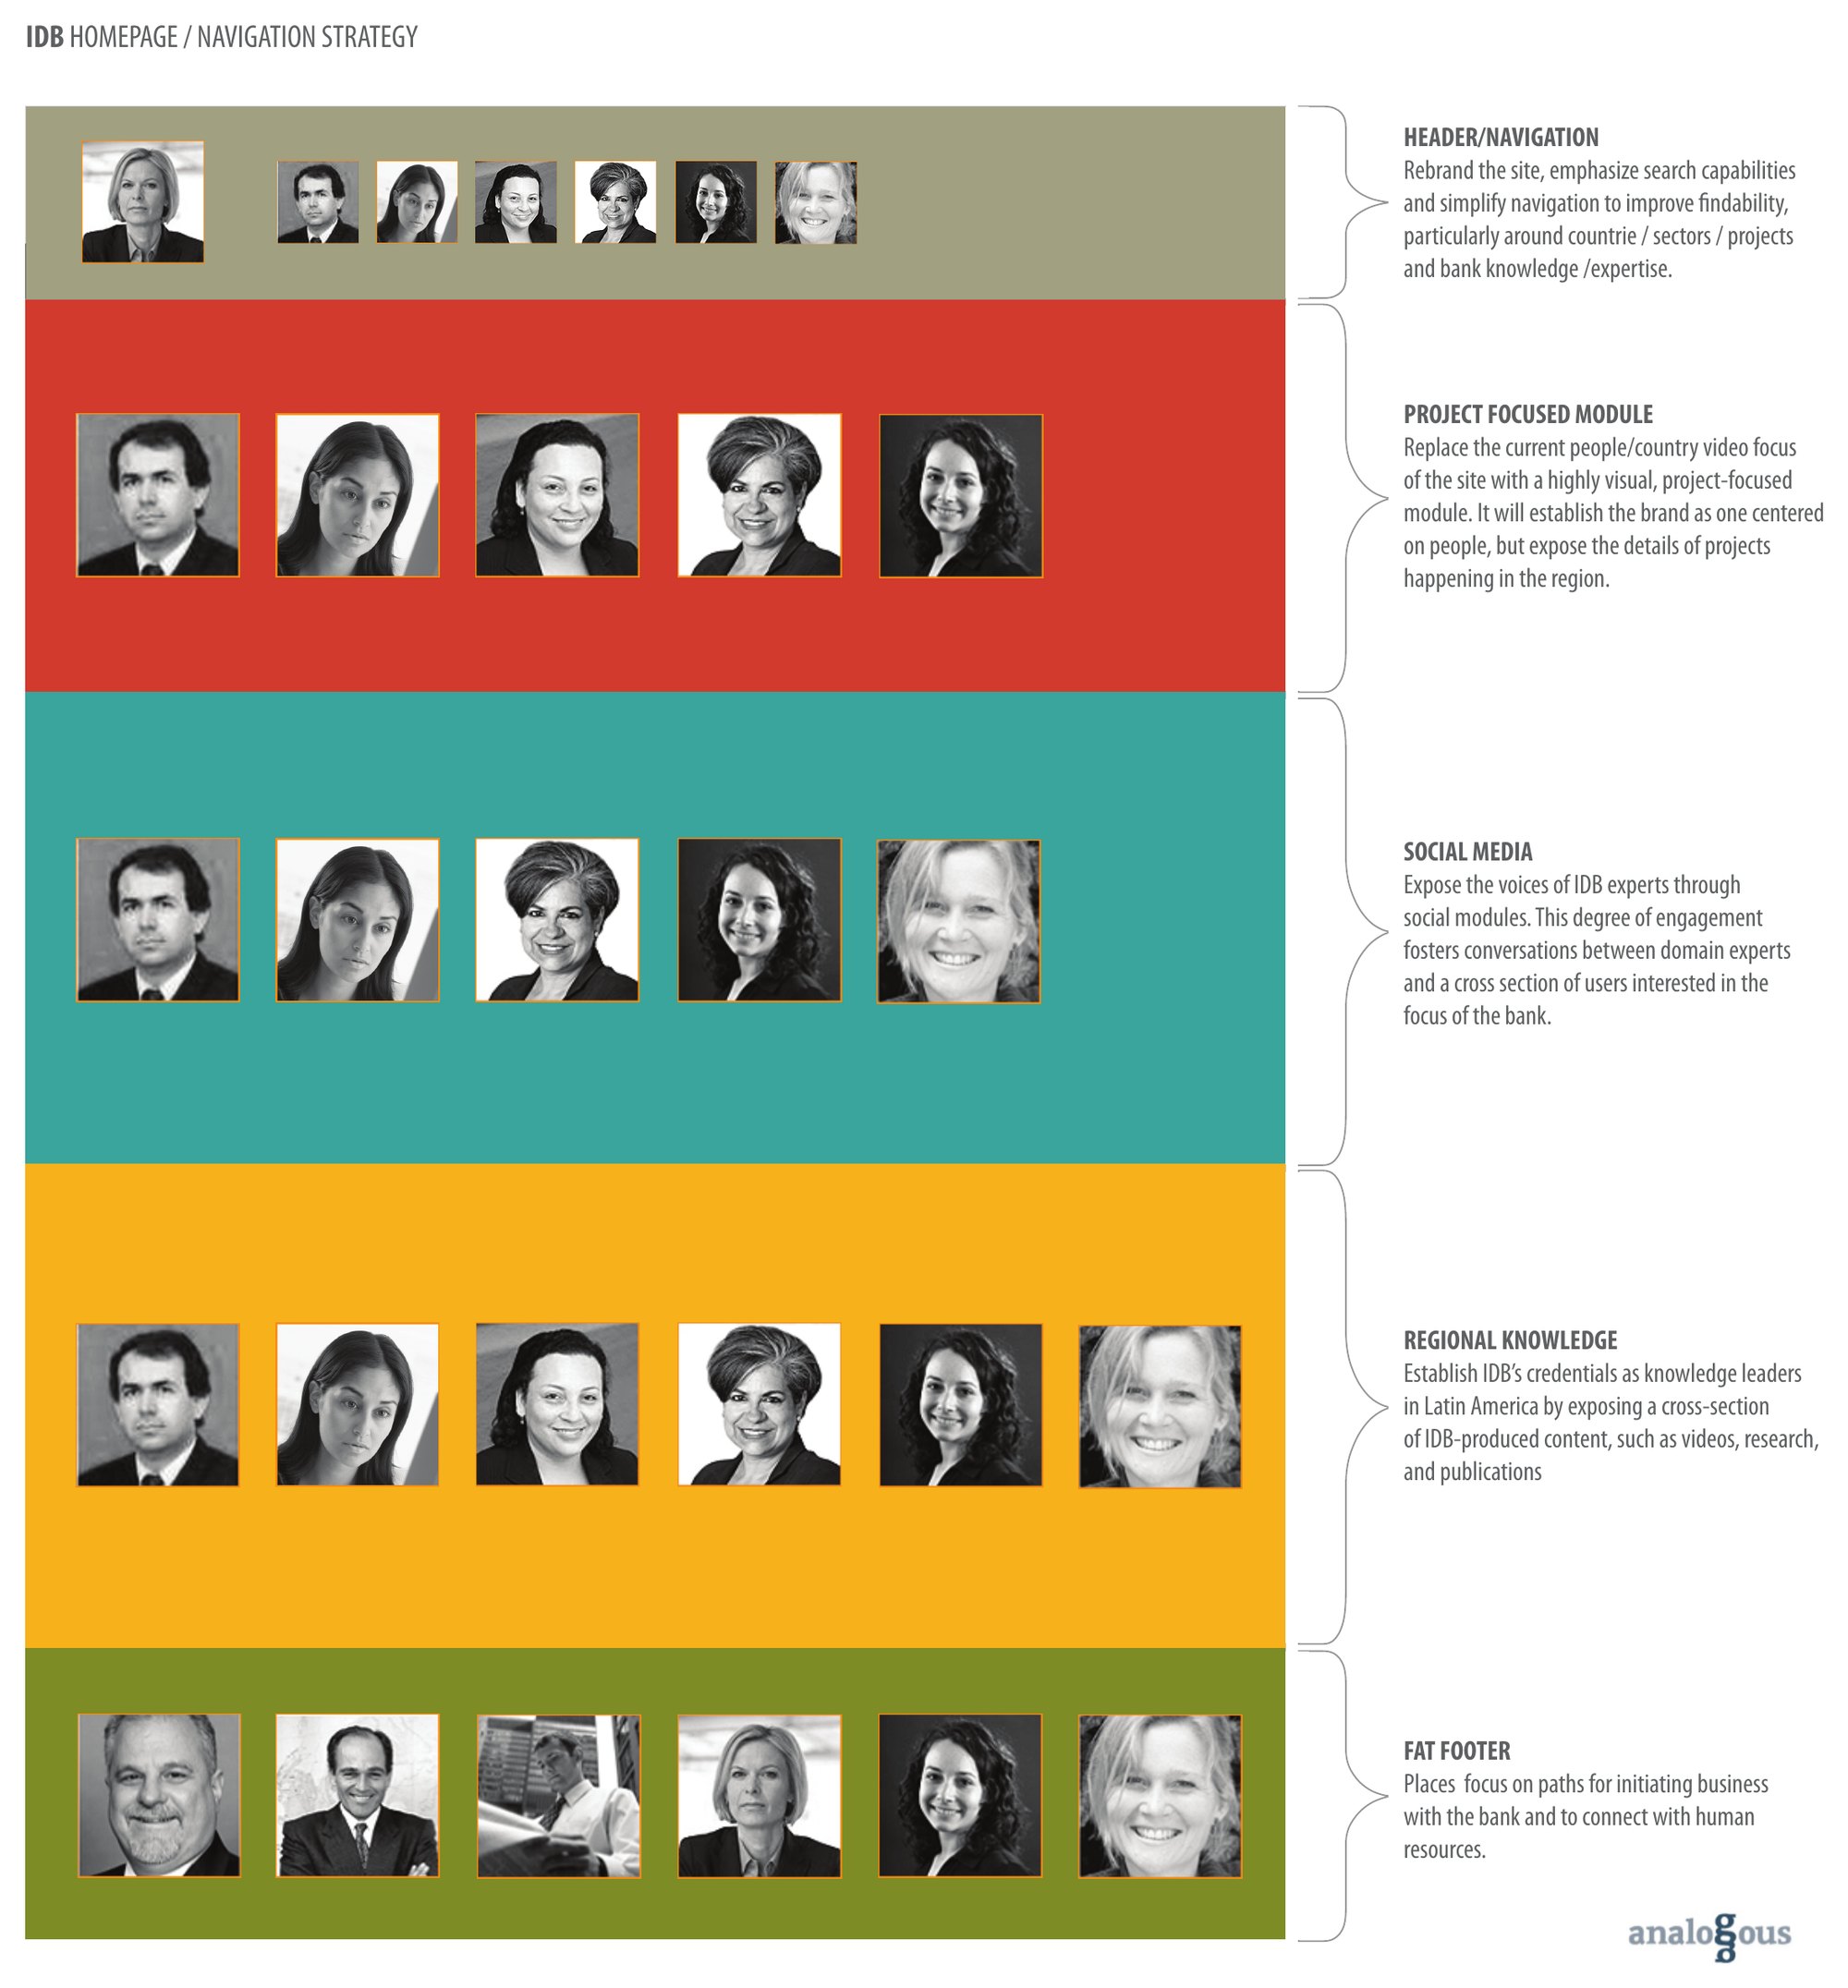
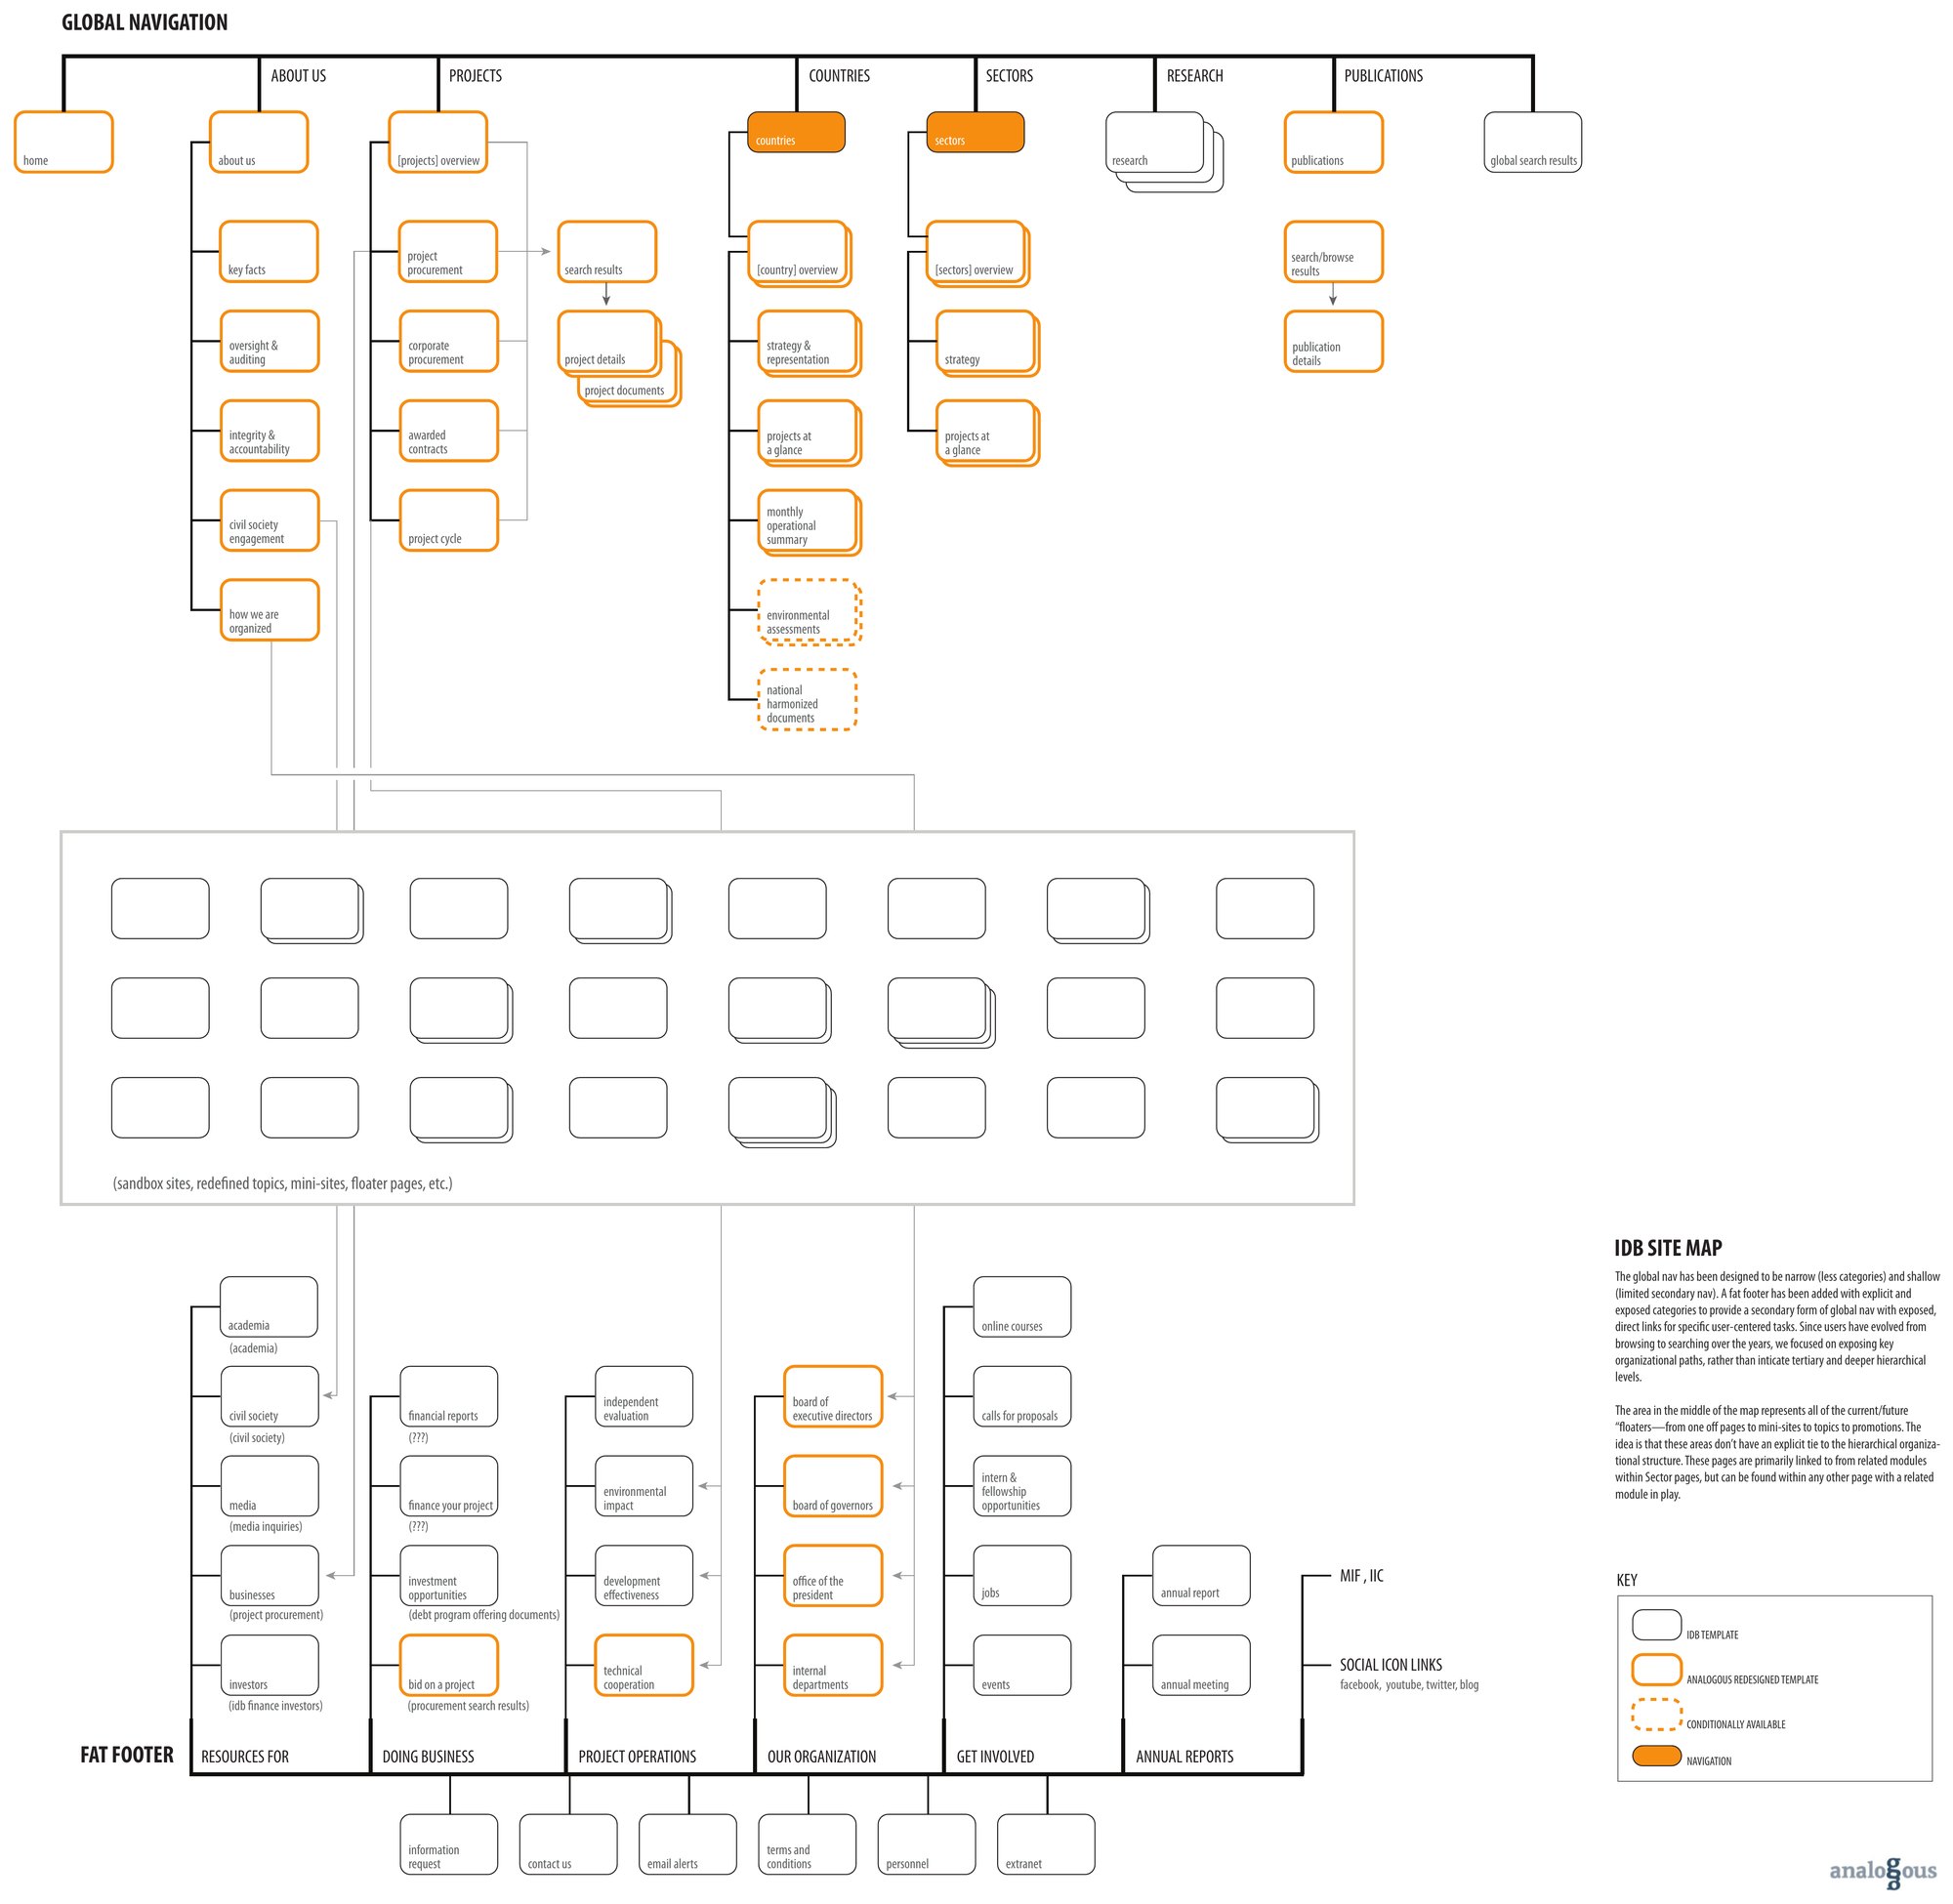
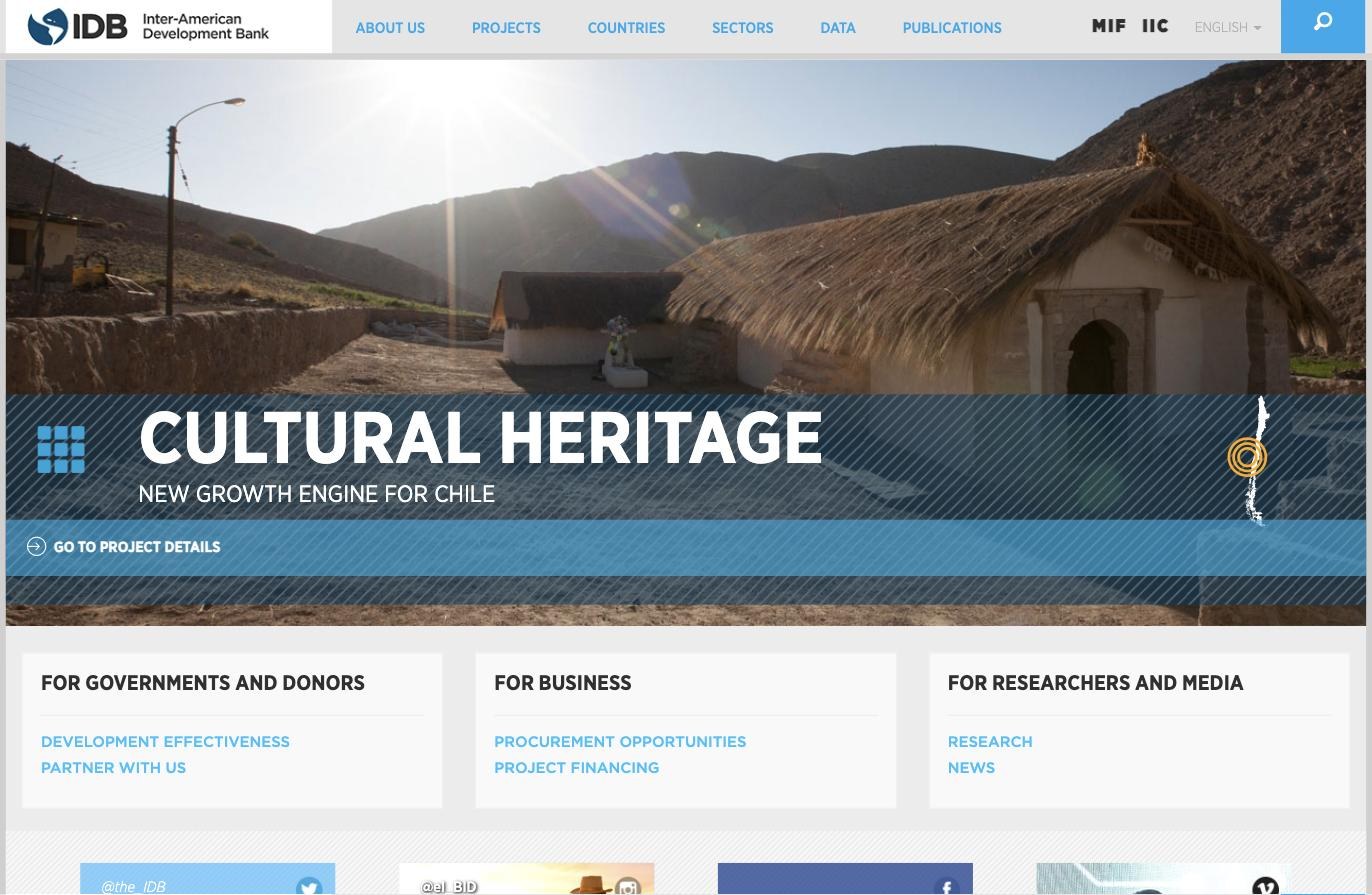
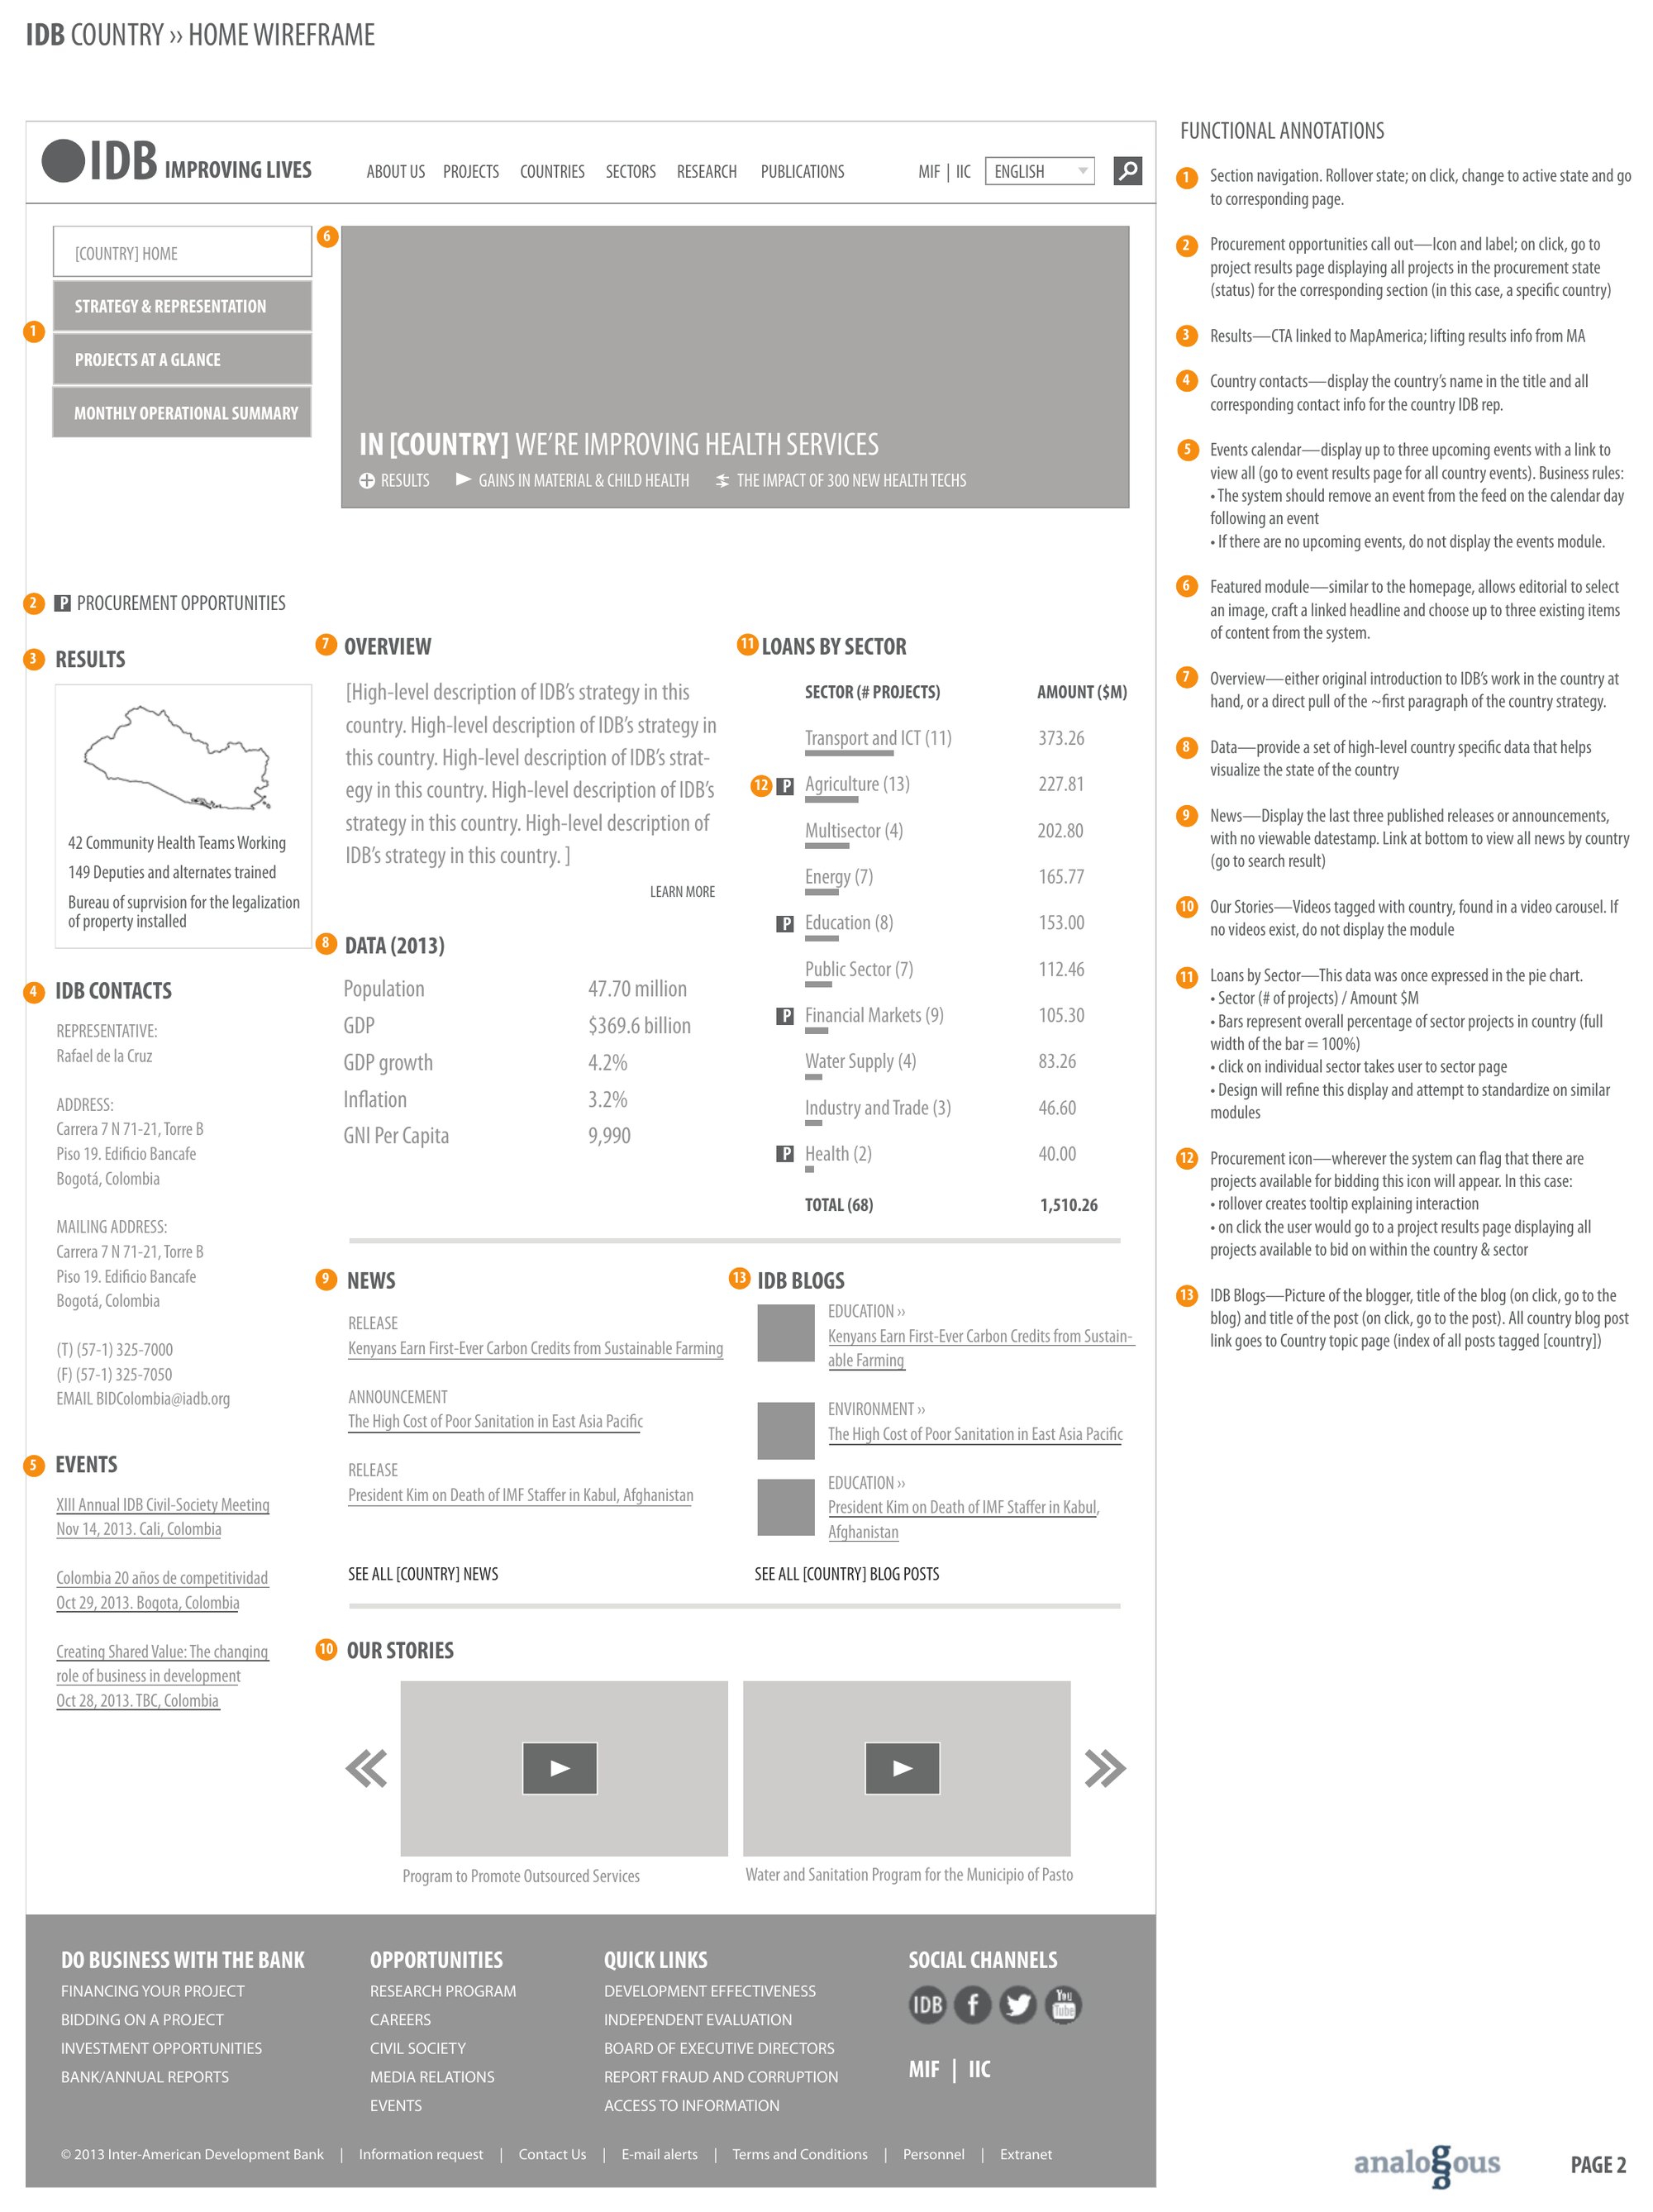
The navigation strategy rebranded the site around the bank’s work. A search across all content, with facets for each content type, sat at the top. The global navigation narrowed to About us, Projects, Countries, Sectors, Research, and Publications. The homepage replaced its people and country videos with a project-focused module, such as “In Honduras, we’re improving health services,” linked to the project’s results. Modules for experts’ voices and regional knowledge established the bank’s credentials, and a fat footer made paths for doing business with the bank plain.
Each homepage module was mapped to the persona expectations it served, so every element had someone it was for.
Give every country and sector a front door
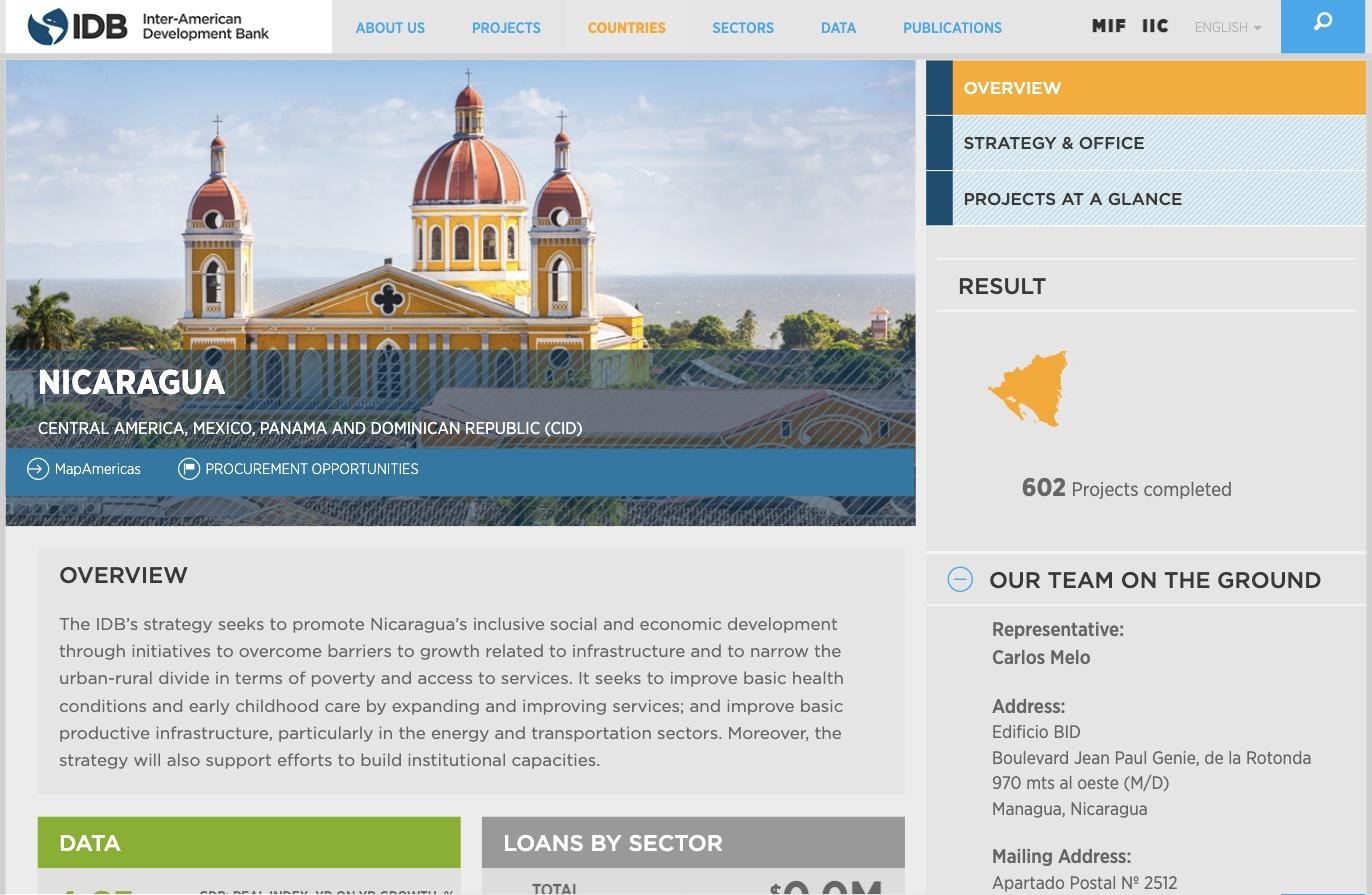
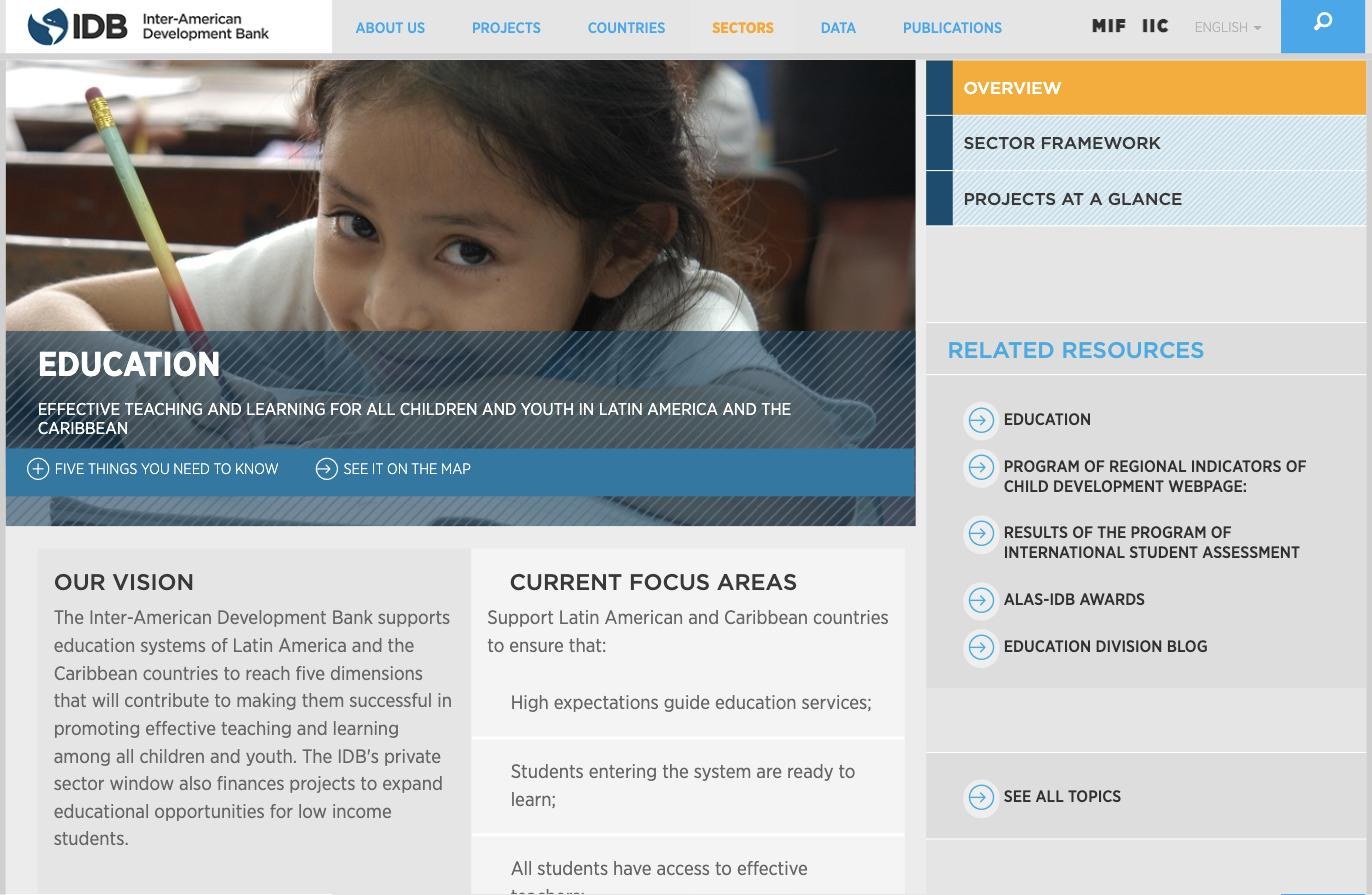
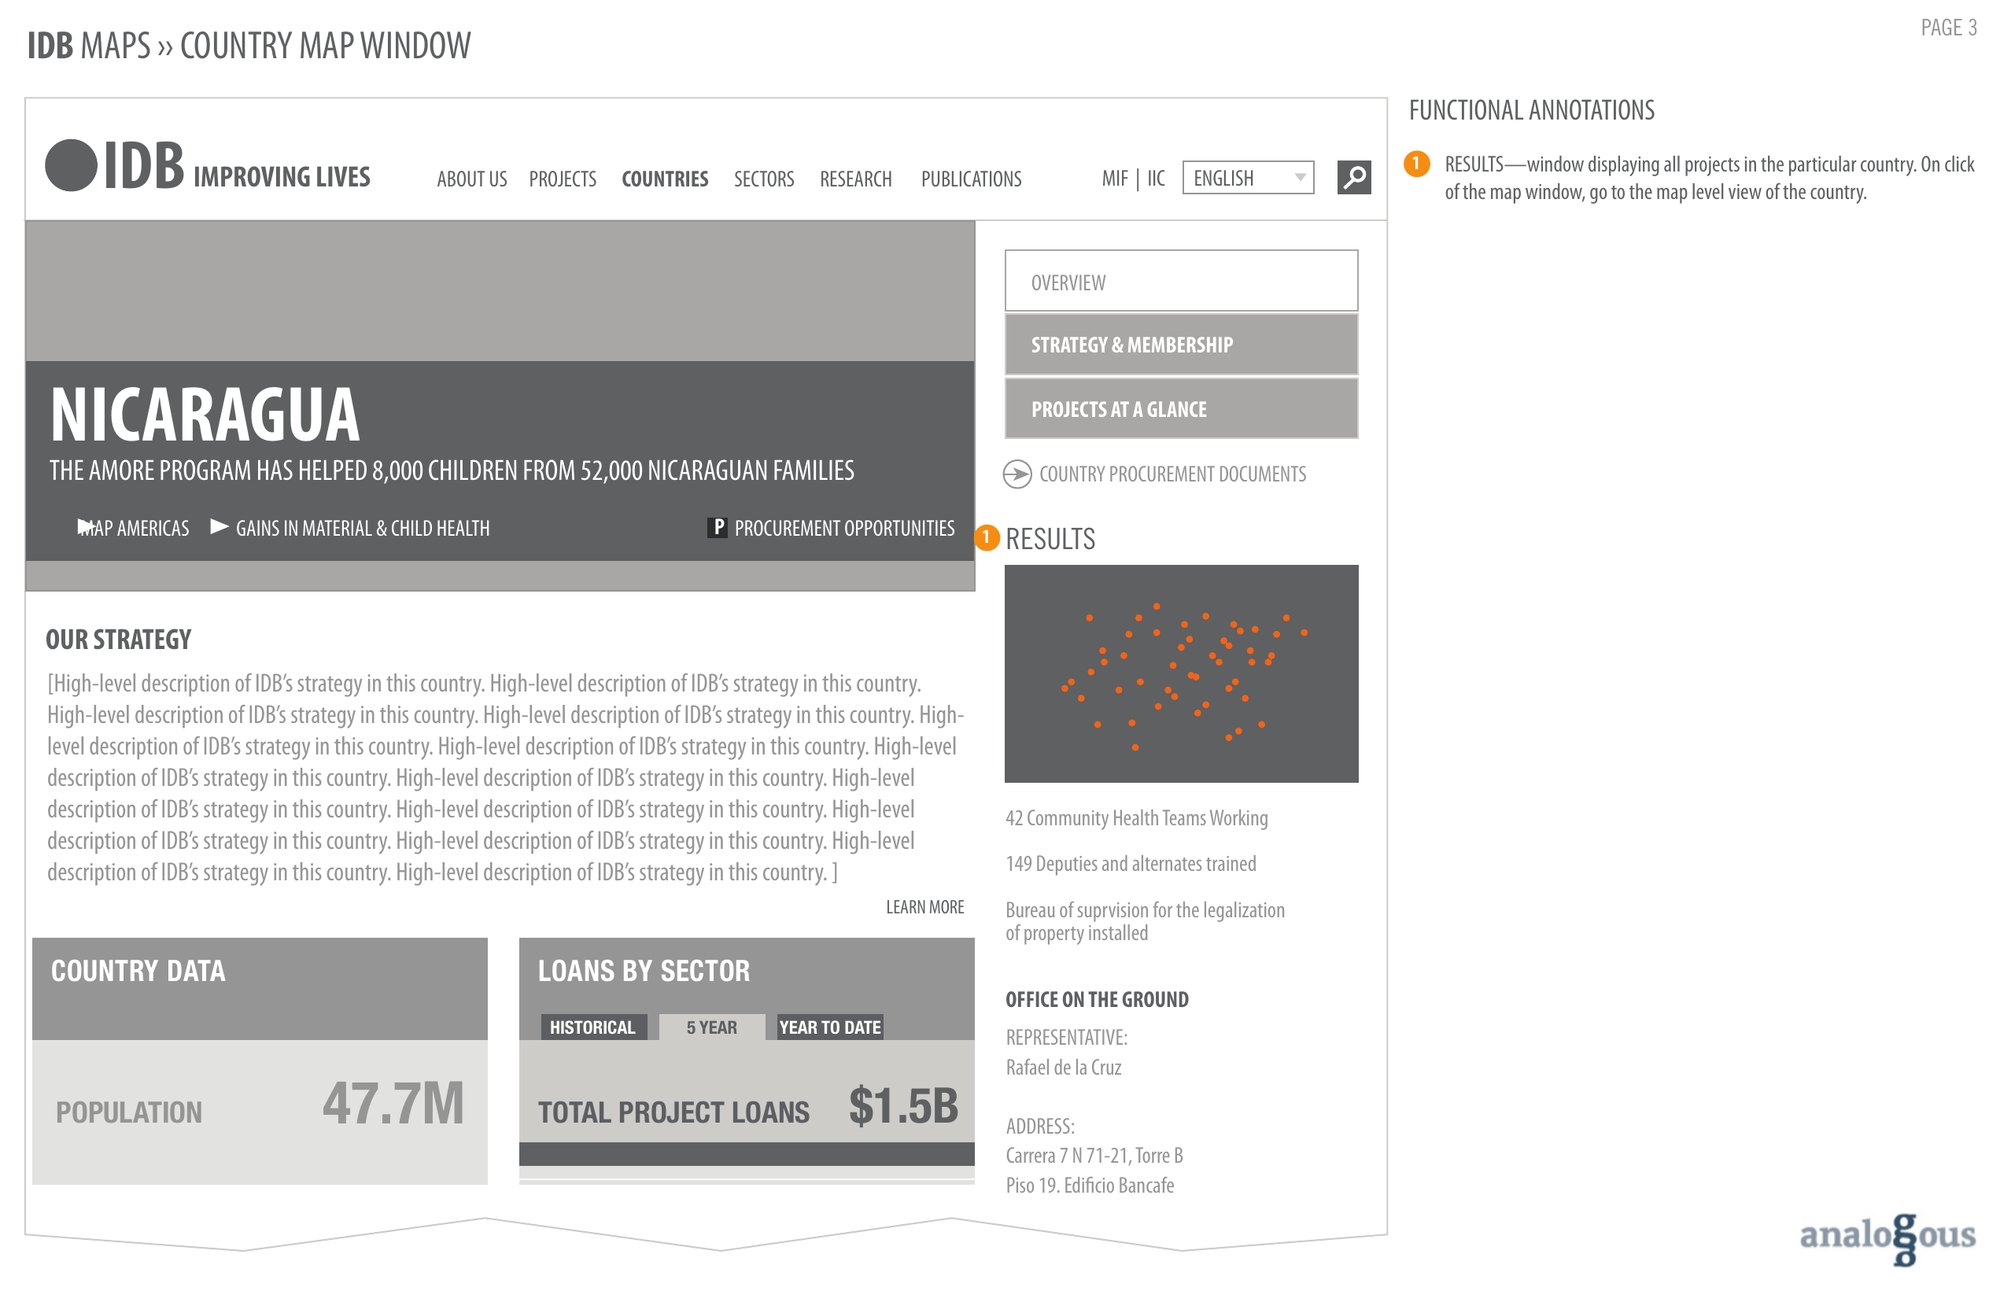
Country and sector pages became templates that led with the bank’s work. A country page opened with the IDB’s strategy and representation there and its projects at a glance, then results linked to the map, country data, loans by sector, and the people to contact. A procurement call-out took bidders straight to every project open for procurement in that country. Sector pages showed the sector’s current projects on a map, and listed the bank’s internal experts with a strong relationship to the sector.
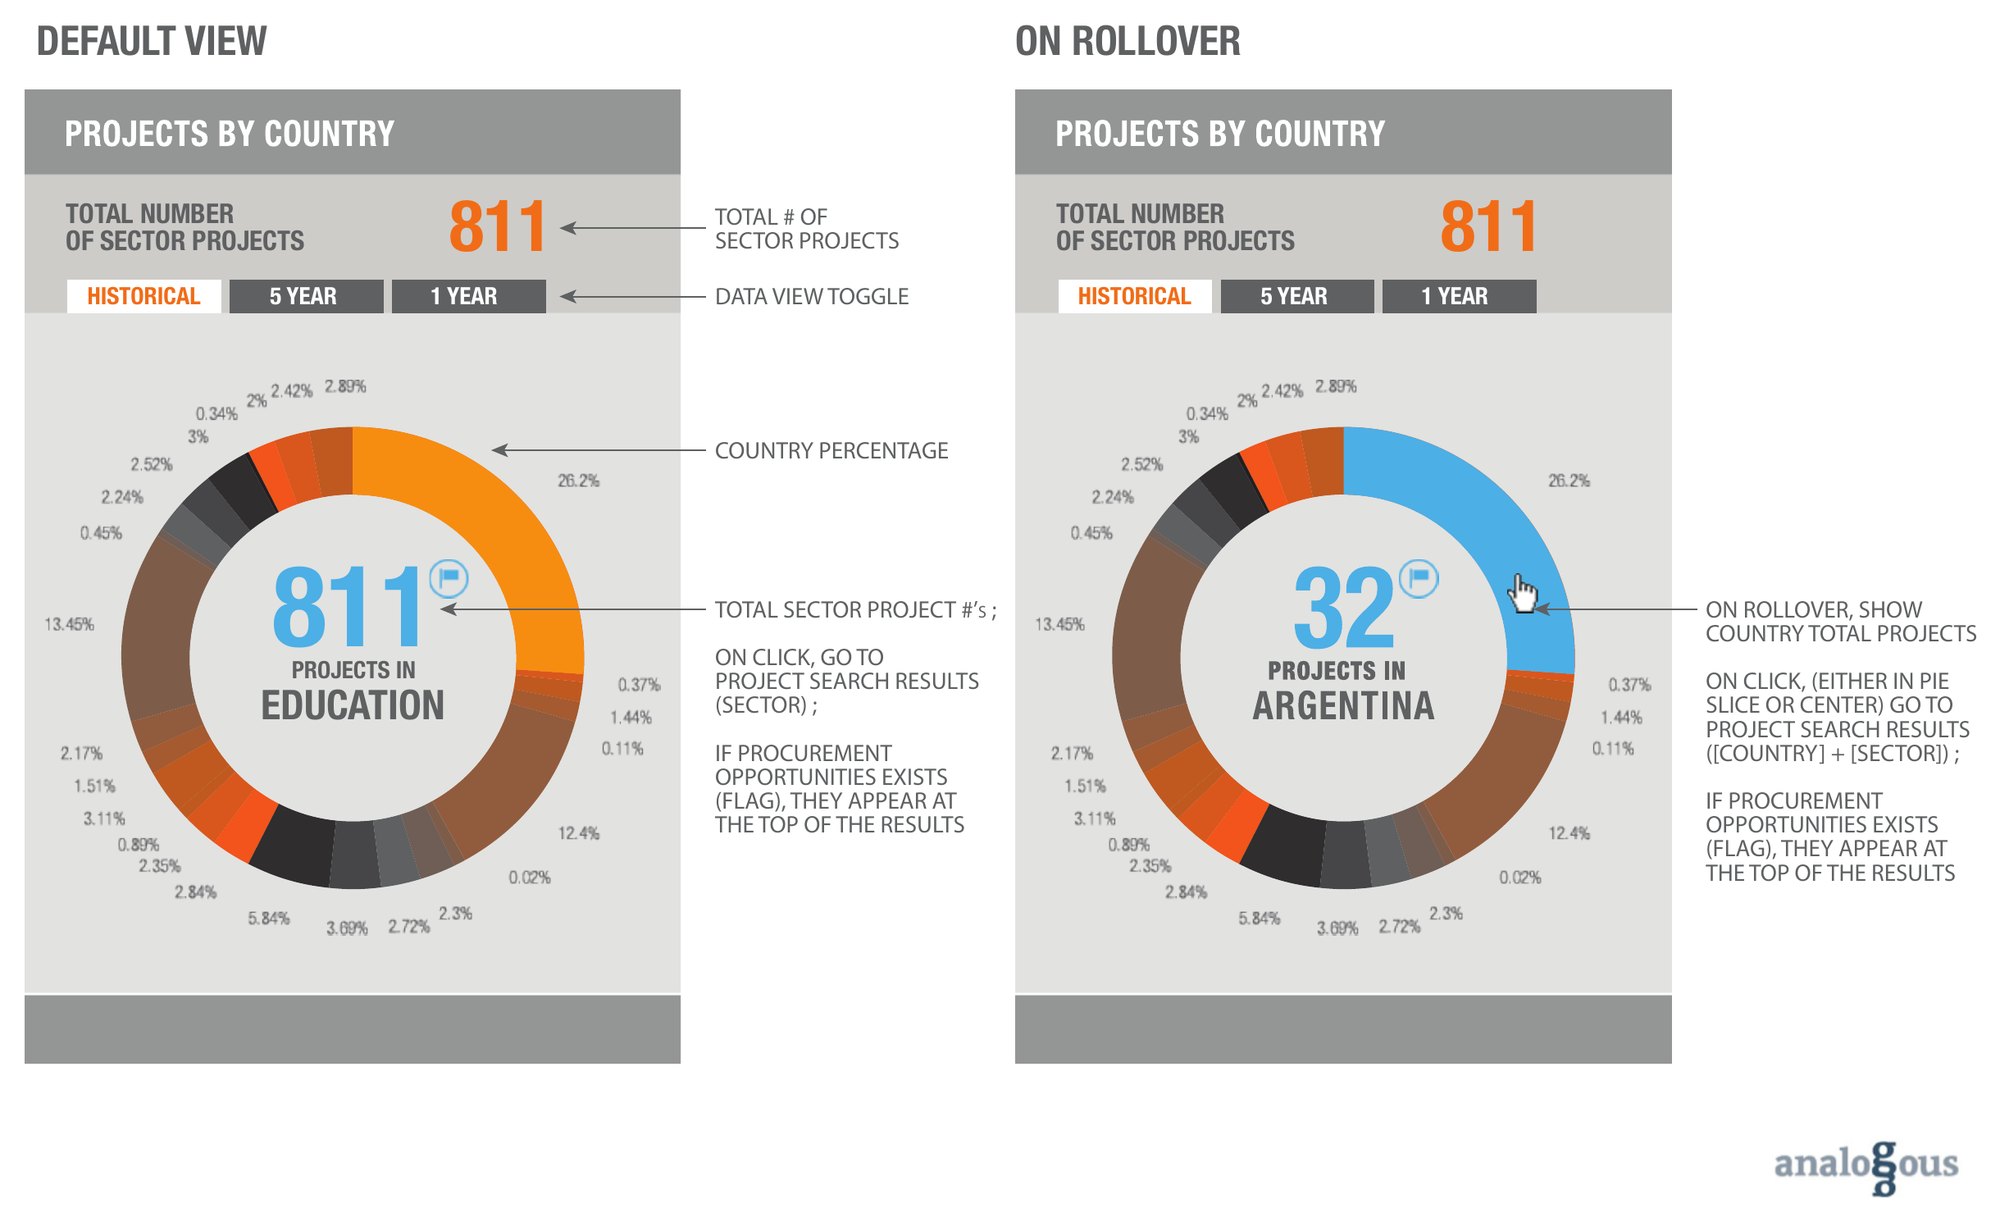
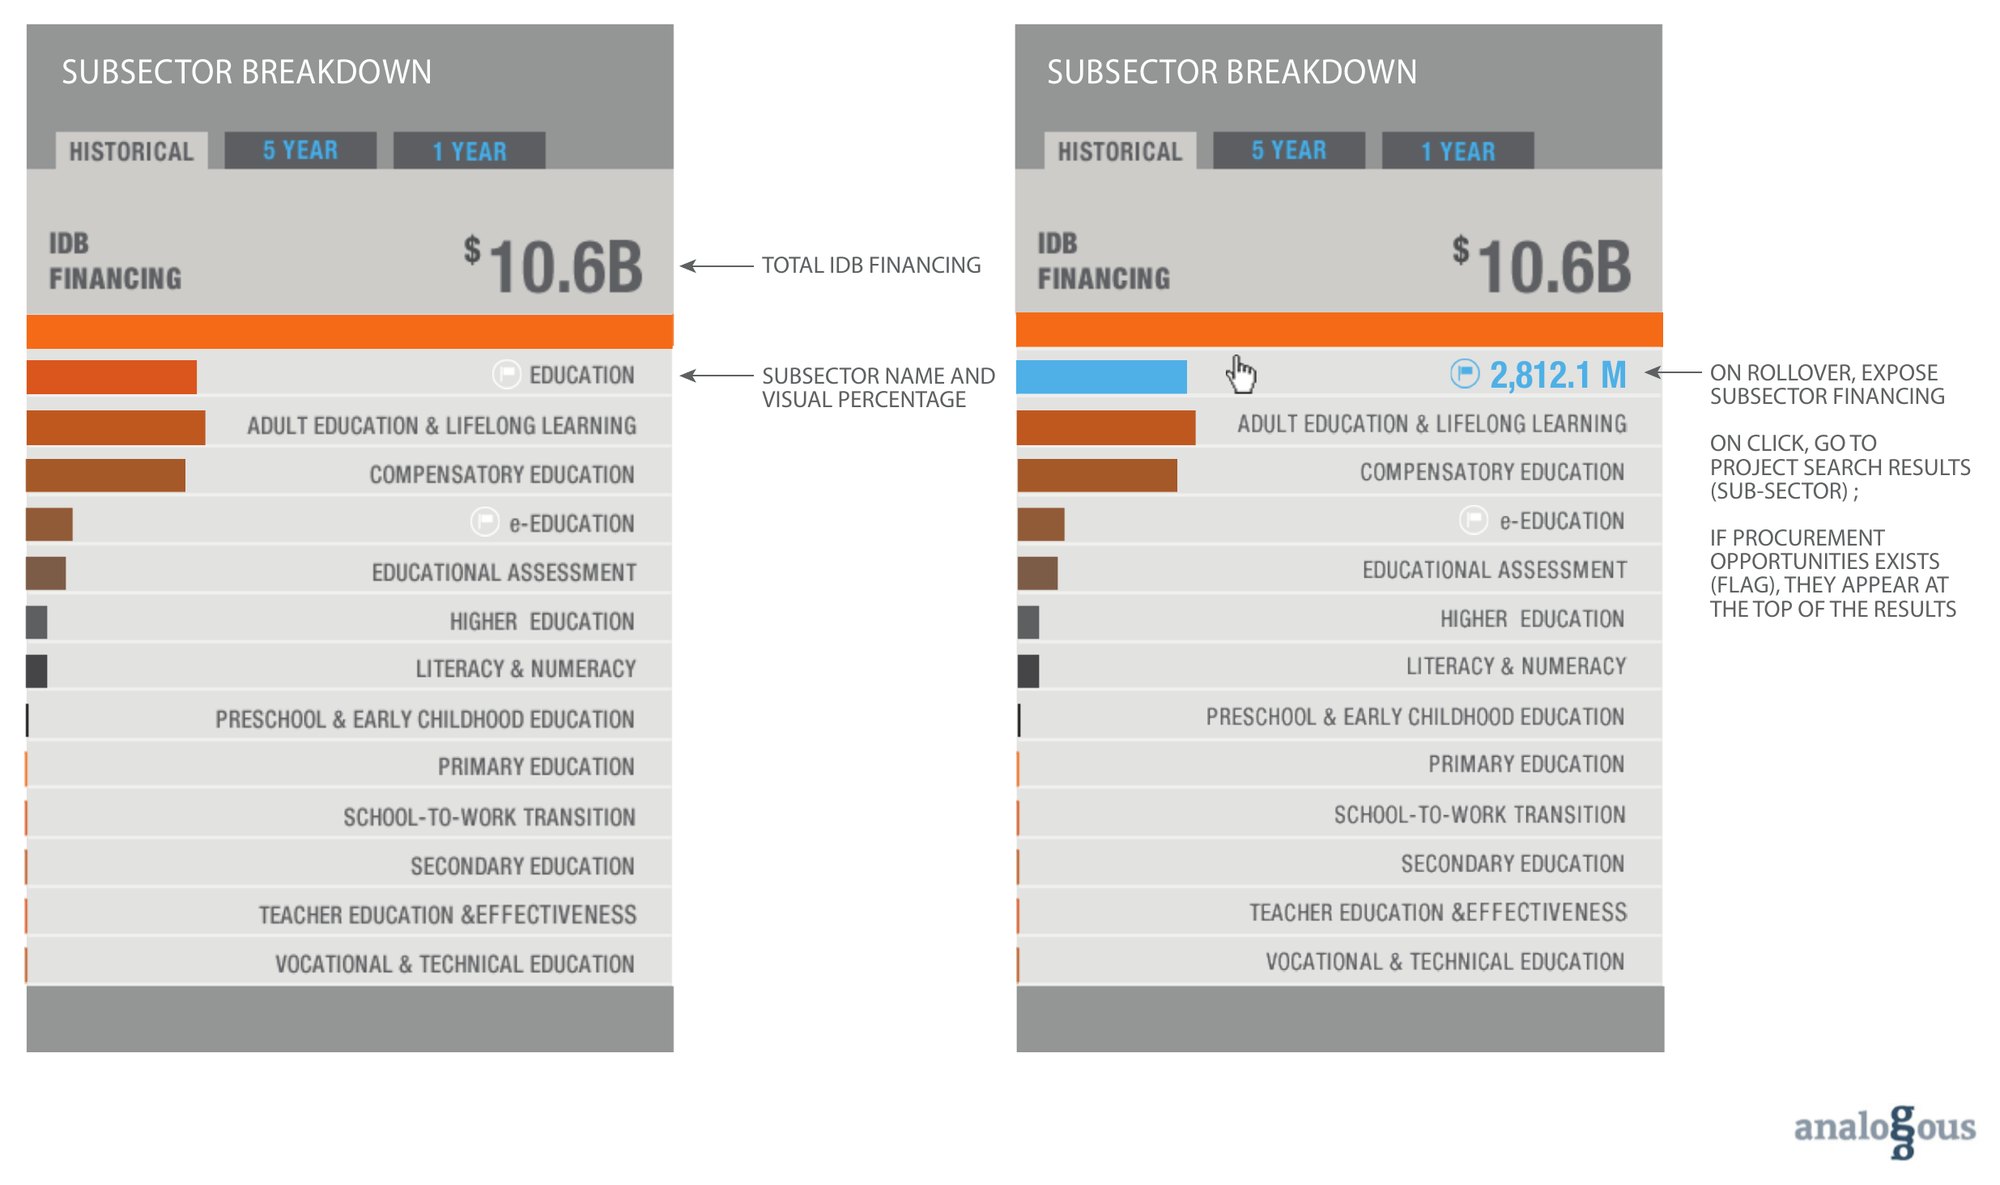
The data views worked the same way. Projects by country could be toggled across historical, five-year, and one-year views, and financing broken down by subsector. Every slice clicked through to project search results, with procurement opportunities at the top.
Track two
Mapamericas
From a workshop on how project data was used to a map inside every page, 2015.
Put the map inside every page
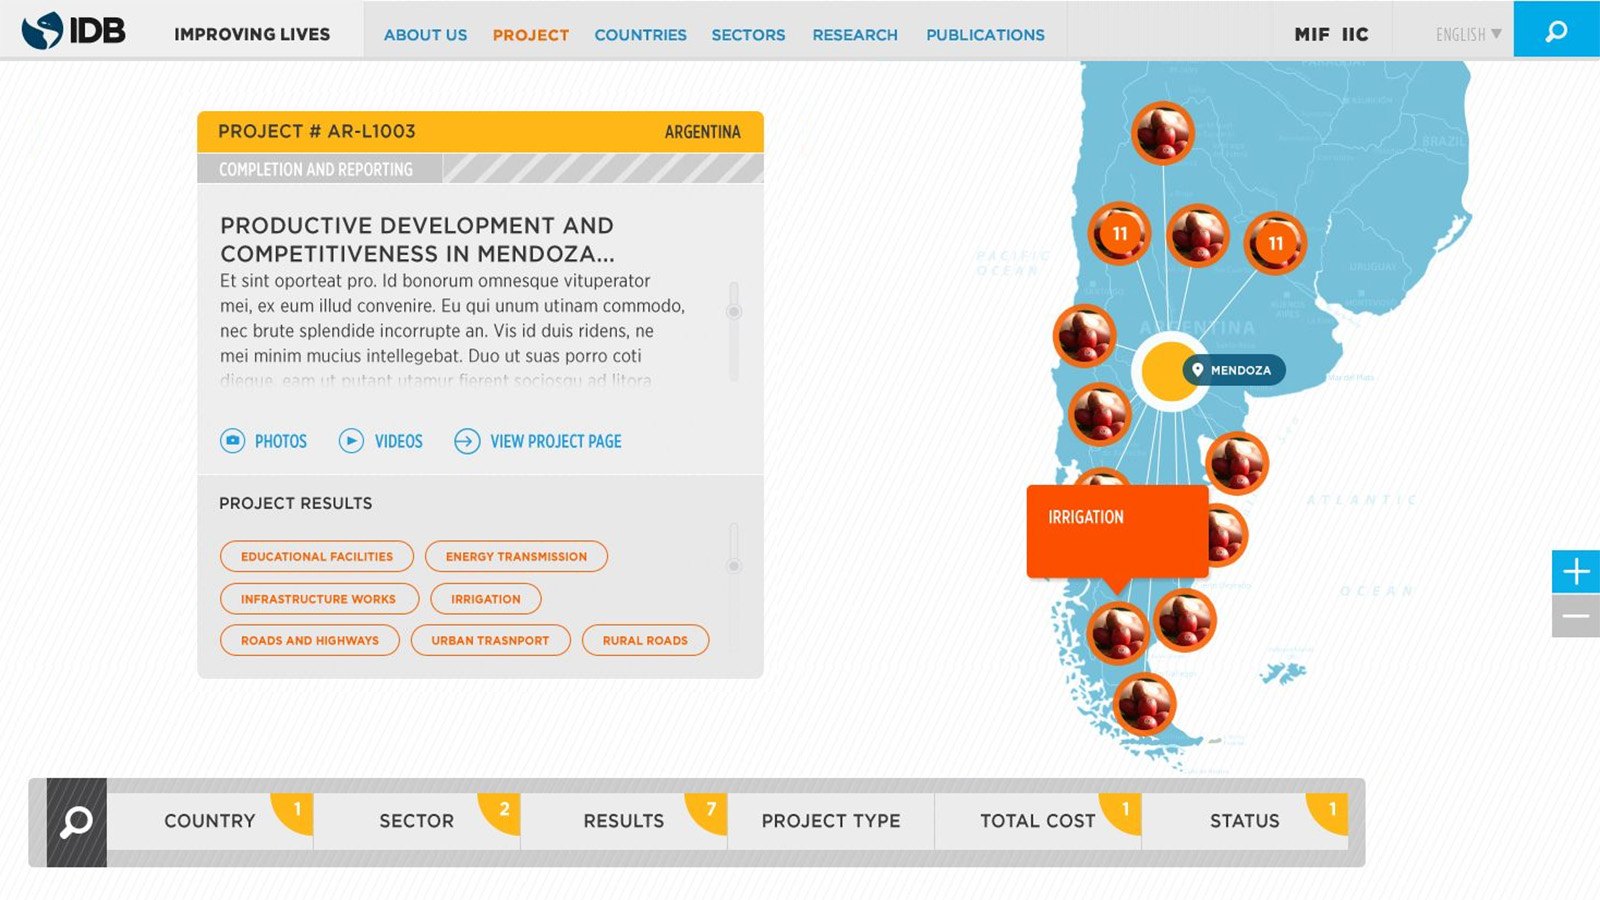
The bank had data on every project, in progress or finished, but the previous experience wasn’t an experience. It was data. Before designing anything, I led a workshop with the IDB team to uncover how project data was actually used, then worked through approaches to discoverability with them. That work landed on Mapamericas.
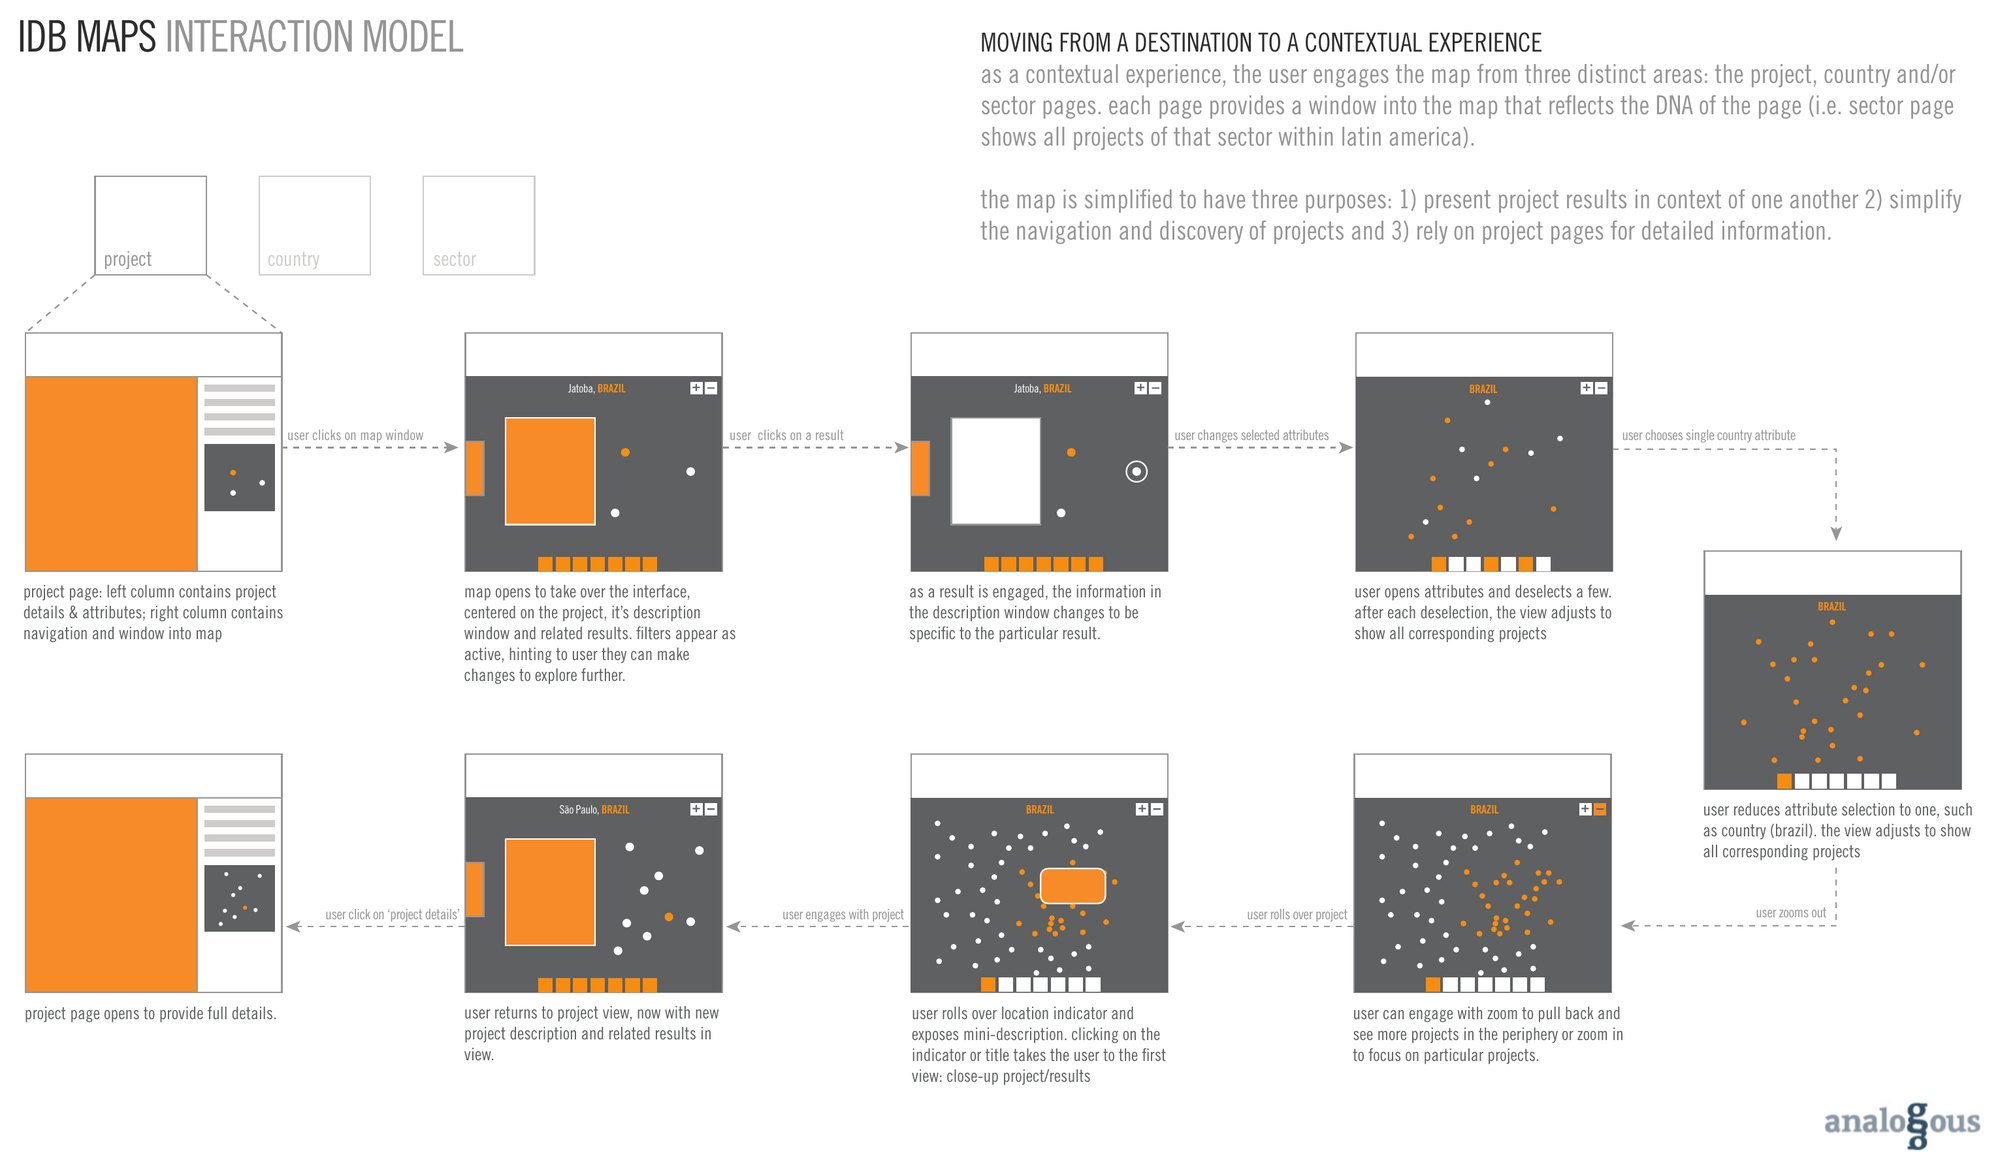
My idea was to move the map from a destination to a contextual experience. Instead of asking people to find a map, every project, country, and sector page opened a window into it, reflecting the DNA of the page: a sector page showed all of that sector’s projects across Latin America.
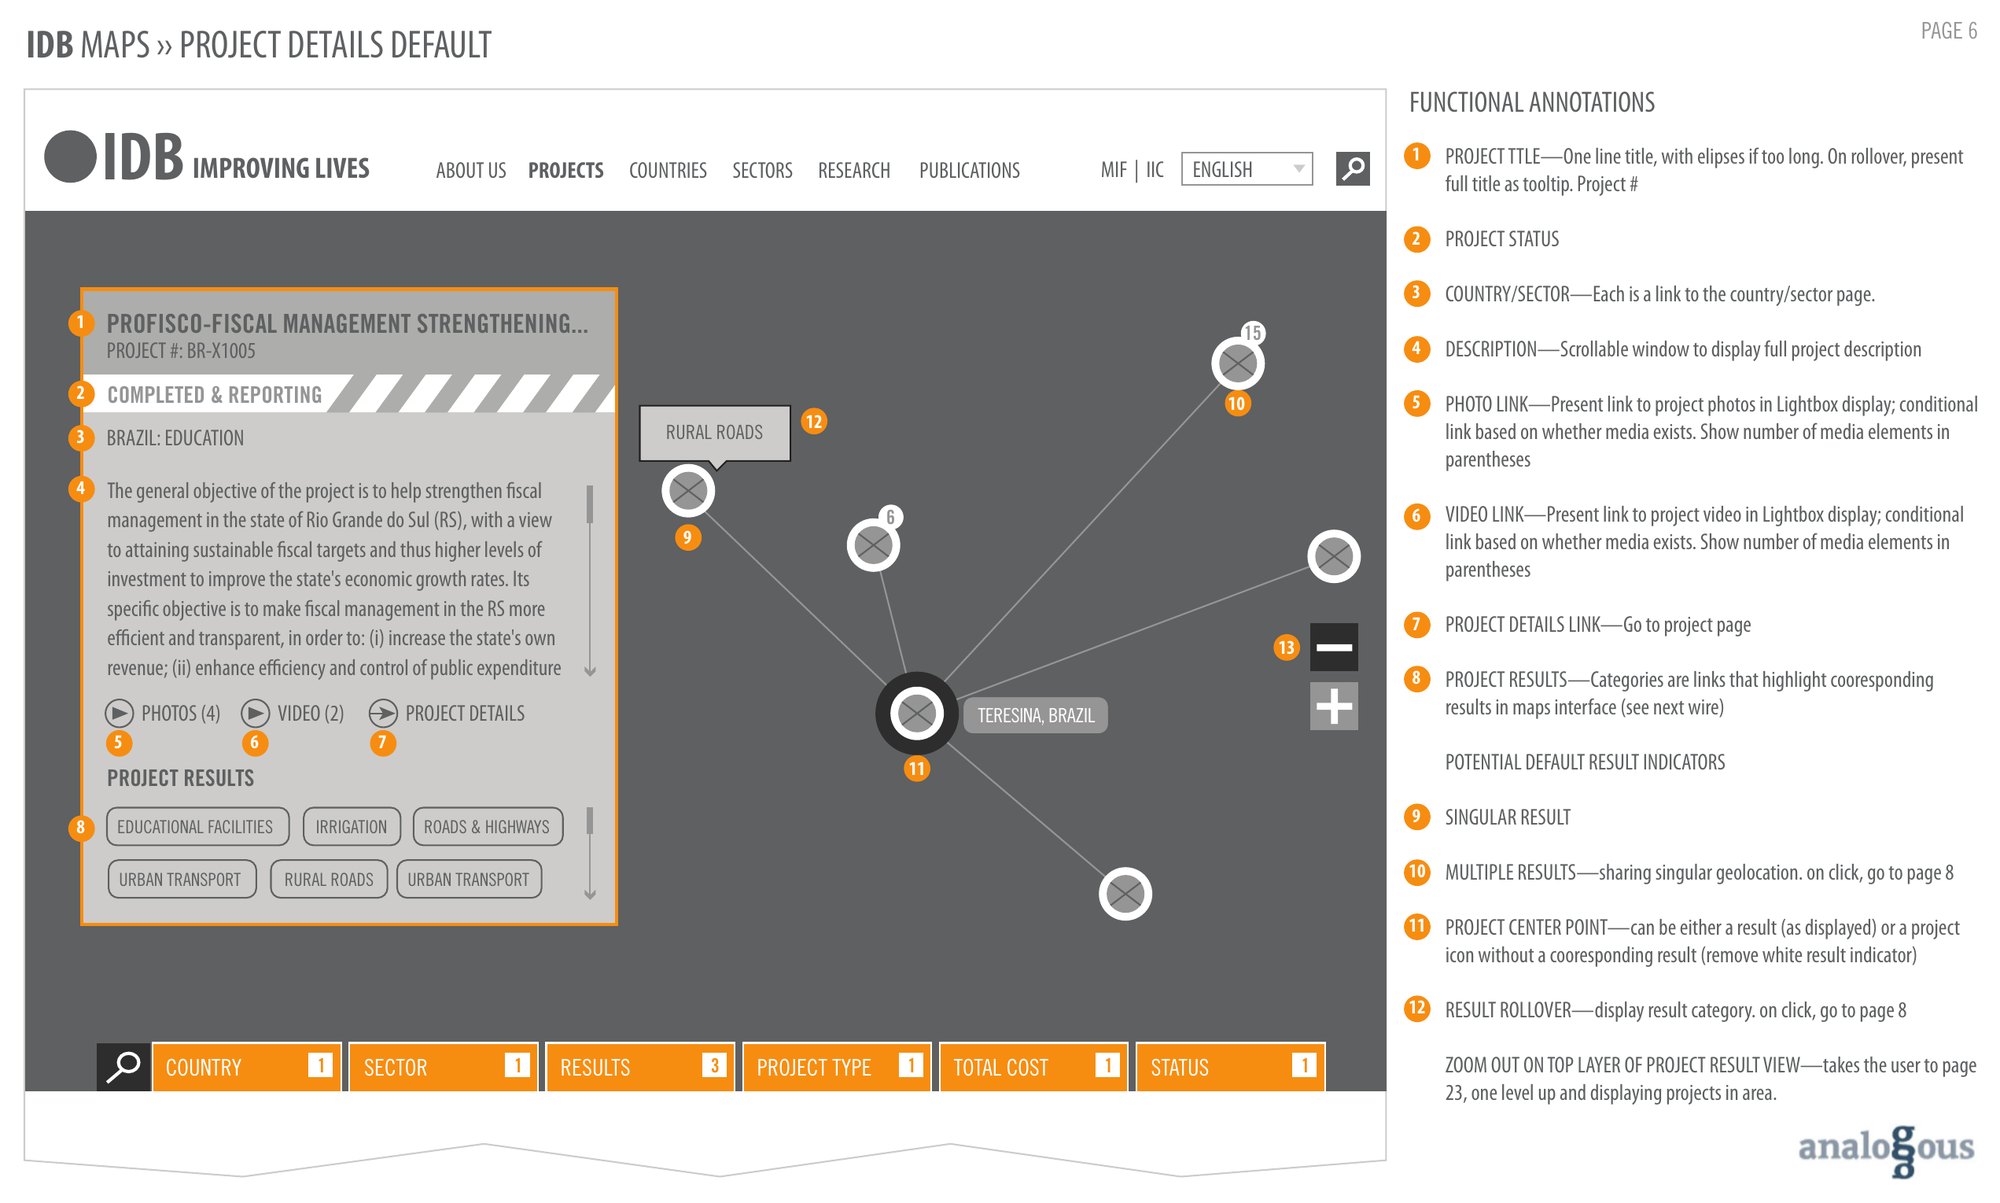
The map had three jobs: present project results in the context of one another, simplify the navigation and discovery of projects, and rely on project pages for the details. Clicking the window let the map take over the interface, centered on the project, with its description and related results, and filters shown as active to hint that people could keep exploring. Choosing a result changed the description to match it. Deselecting attributes, or zooming out, revealed every project that fit.
Track three
Learning
Making the bank’s courses easy to find and register for, 2015.
Make courses findable
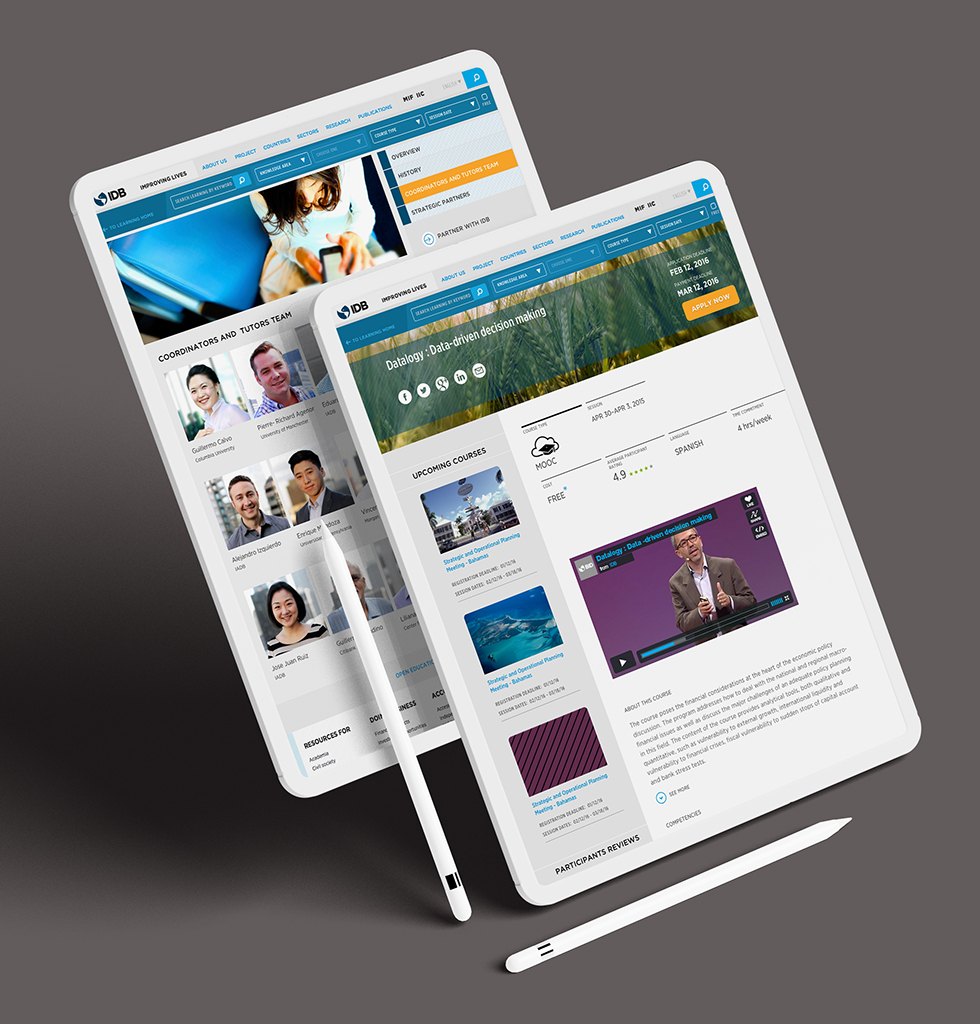
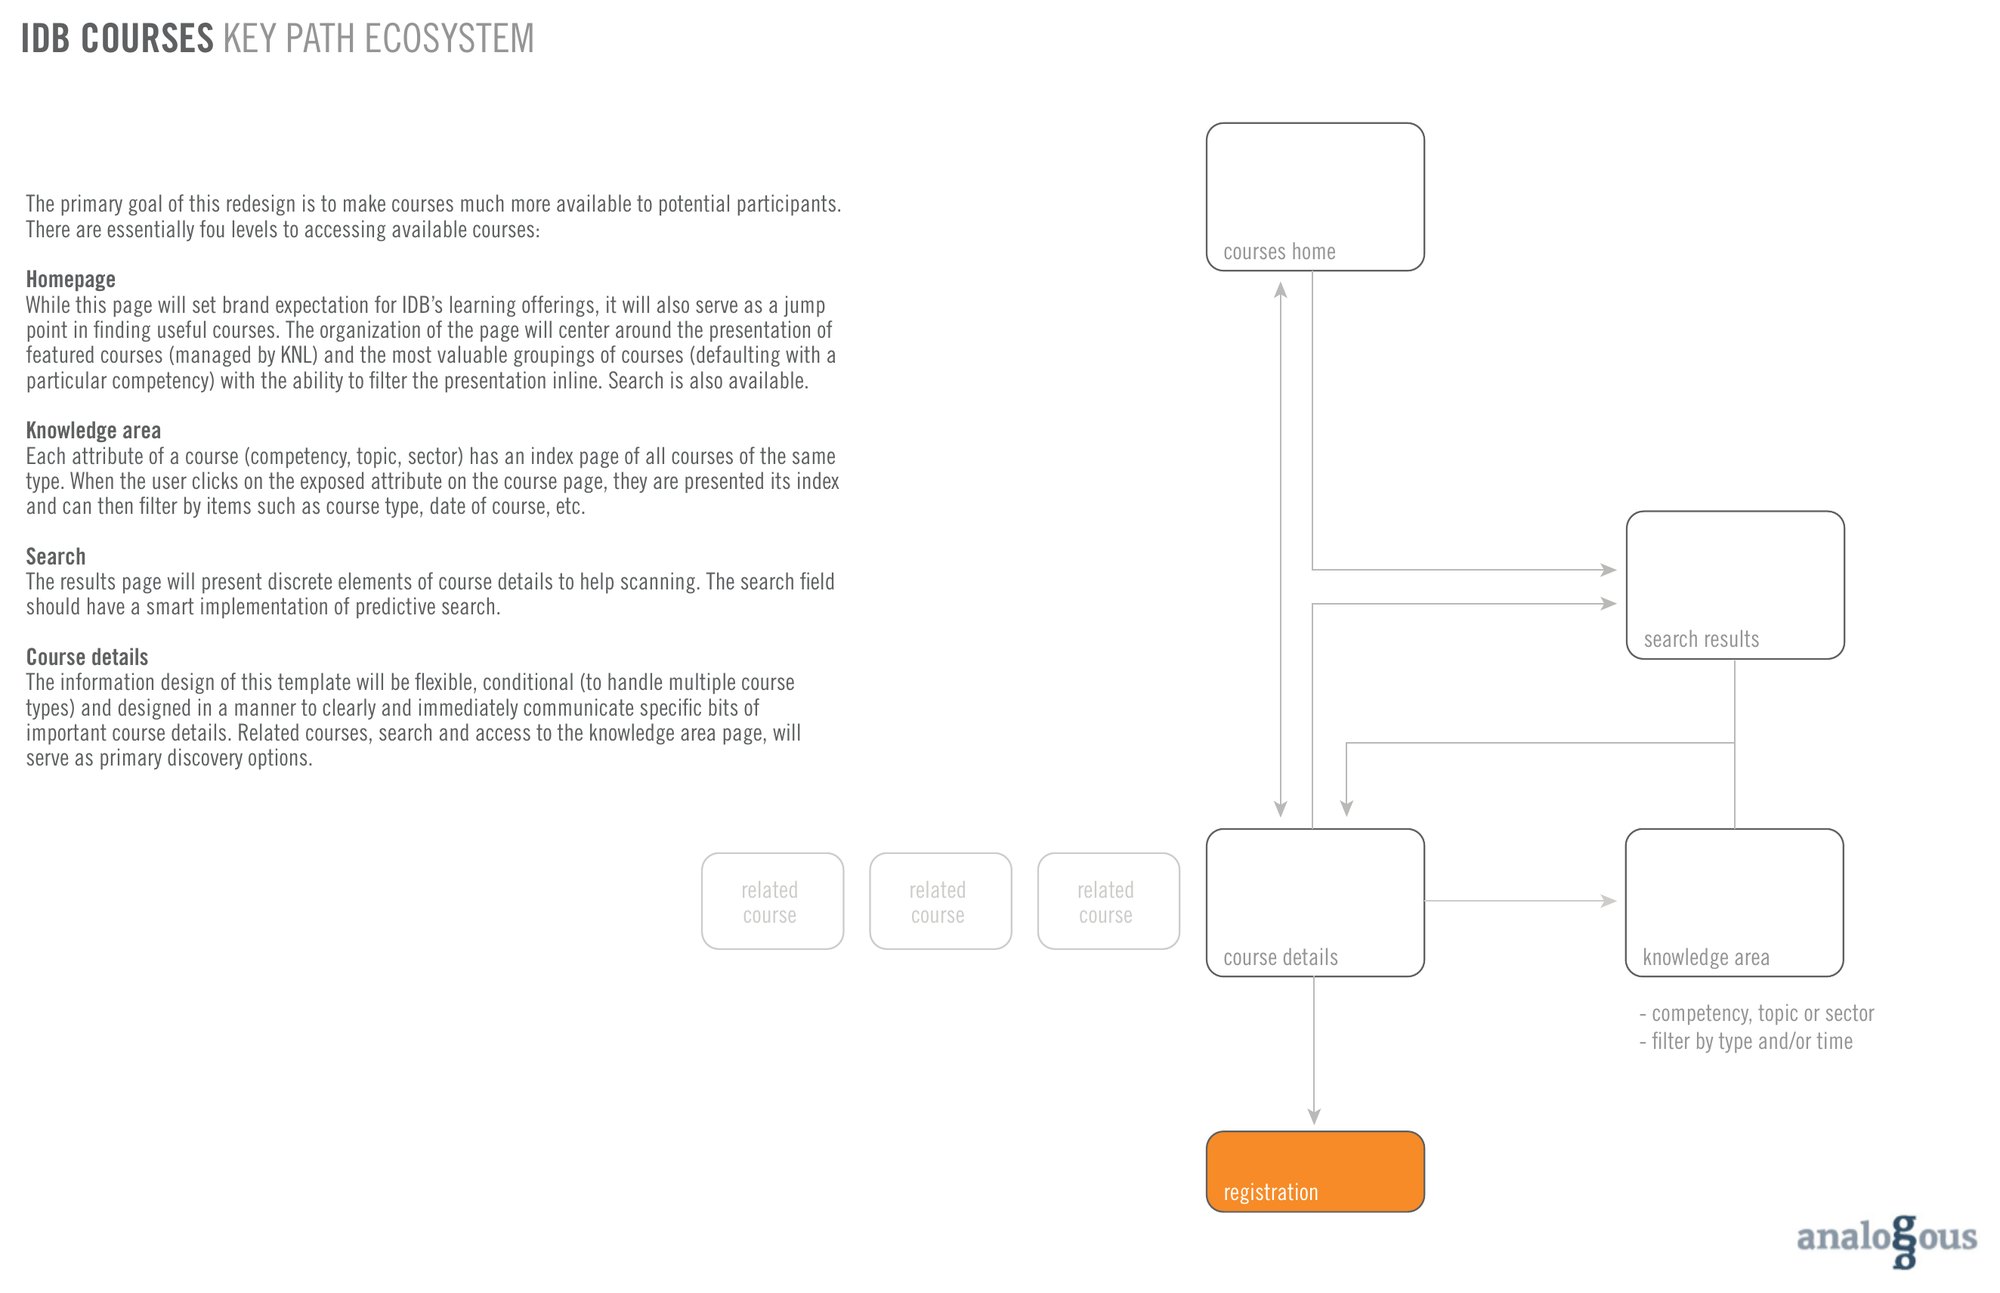
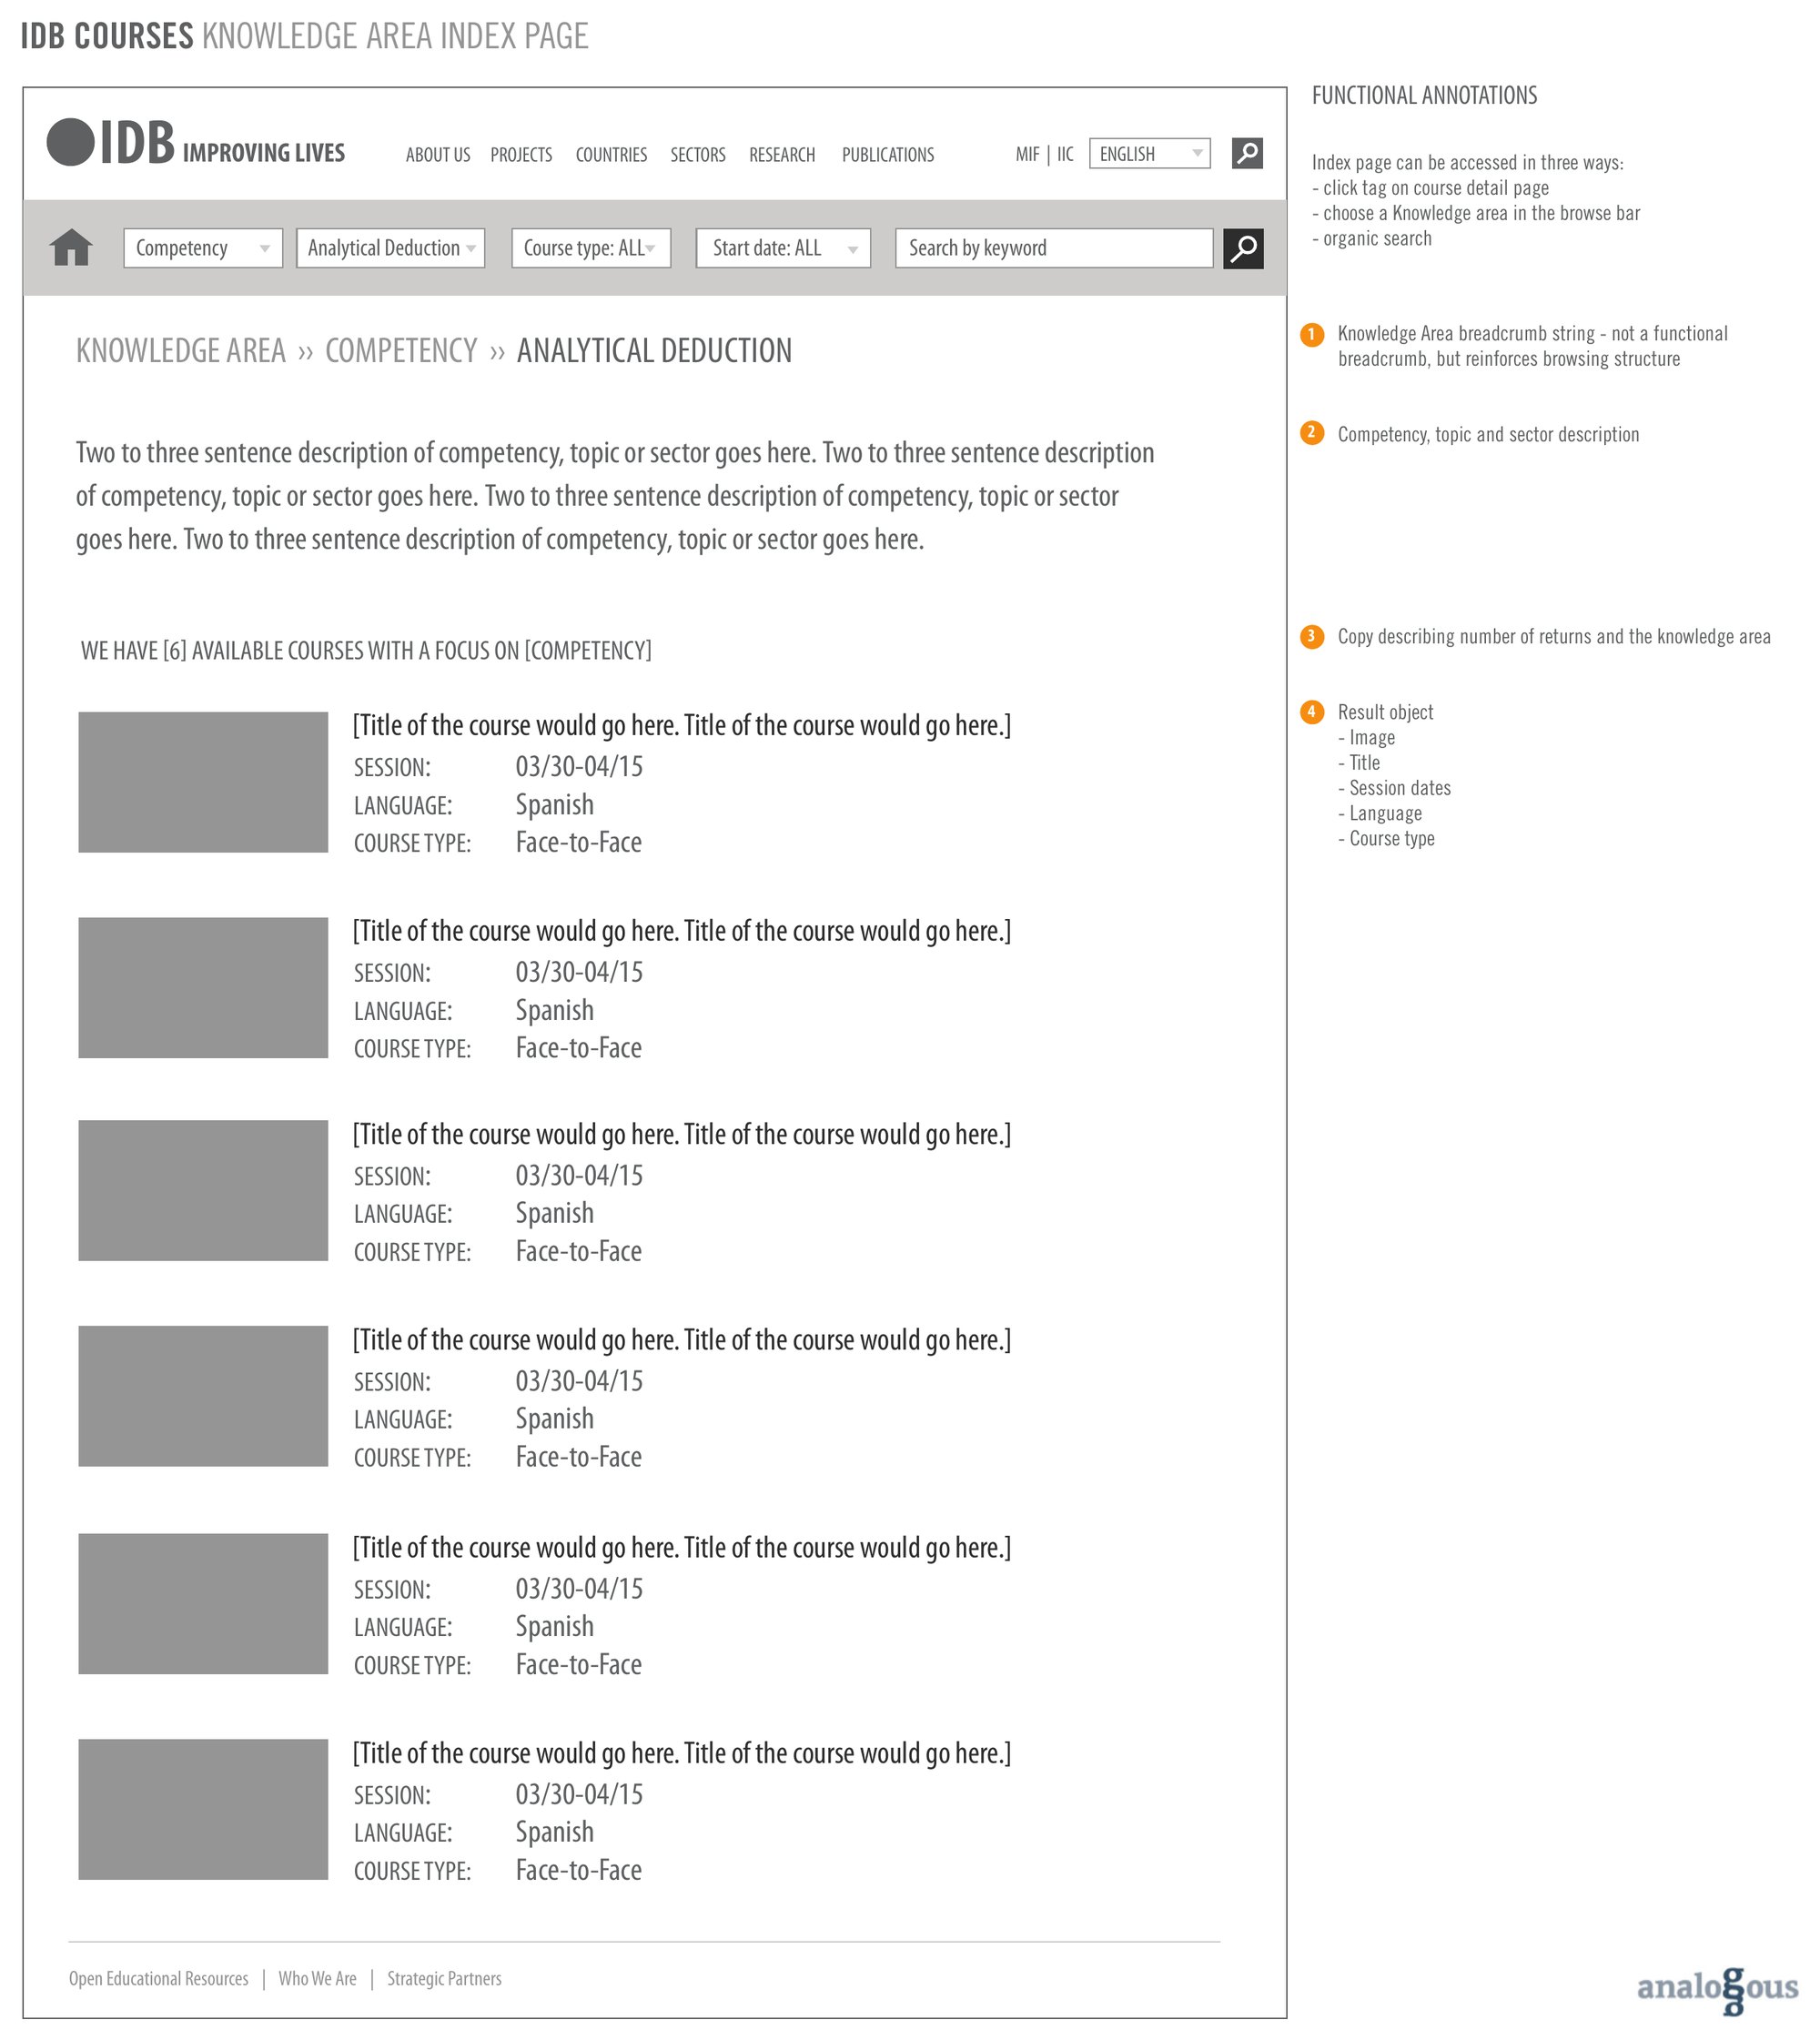
The bank offered courses, but people struggled to find them, to enroll, and even to know they existed. The redesign mapped four levels of access. The courses home set expectations for the bank’s learning offerings, with featured courses and the most valuable groupings, filterable in place. Every attribute of a course, its competency, topic, or sector, had an index page of all courses like it. Search results surfaced the course details that mattered for scanning, with predictive search. And the course page itself was flexible enough to handle different course types, with related courses and the knowledge areas as paths to discovery.
Alongside the courses, I designed the sign-up and onboarding for a learning community, which hadn’t launched by the time I left.
Key learnings
- Fit the model to the audience.Goal-Directed Design usually narrows to a primary persona for a product. A development bank’s site has no single primary user. Persona expectations kept the rigor of the method, while matching the breadth of people the IDB served.
- Start from the research that already exists.Interview records from a previous firm gave the work a foundation. Synthesizing them into a new model moved the project forward faster than starting discovery over, and kept the bank from repeating conversations it had already had.
- Find the spine, and hang everything on it.A bank this size produces stories, research, events, and data in every direction. Projects were what tied them together, so they became the backbone of the site: the homepage led with them, country and sector pages organized around them, and every chart and map clicked through to them. One clear spine kept a vast site navigable.
- Data becomes an experience when it meets people where they already are.The project data was complete before we started. Putting a window into the map on every project, country, and sector page turned a database into a picture of where the bank worked, without asking anyone to go looking for it.
- Make the paths to doing business impossible to miss.For contractors, companies seeking financing, and investors, the site was the front door to working with the bank. Procurement call-outs on country pages, procurement opportunities at the top of search results, and a footer built around doing business turned those paths from buried links into part of the structure.
Questions about this project? Email me.